
קובץ:Voltage regulator foldback.svg

גודל התצוגה המקדימה הזאת מסוג PNG של קובץ ה־SVG הזה: 278 × 276 פיקסלים. רזולוציות אחרות: 242 × 240 פיקסלים | 483 × 480 פיקסלים | 774 × 768 פיקסלים | 1,031 × 1,024 פיקסלים | 2,063 × 2,048 פיקסלים.
לקובץ המקורי (קובץ SVG, הגודל המקורי: 278 × 276 פיקסלים, גודל הקובץ: 45 ק"ב)
| זהו קובץ שמקורו במיזם ויקישיתוף. תיאורו בדף תיאור הקובץ המקורי (בעברית) מוצג למטה. |
תקציר
| תיאור |
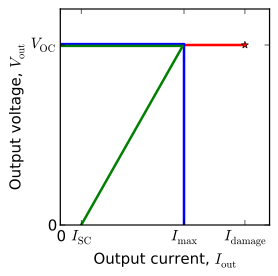
English: Voltage regulator V-I curves for foldback, current limited, and unlimited. |
| תאריך יצירה | |
| מקור | נוצר על־ידי מעלה היצירה |
| יוצר | Nanite |
| SVGהתפתחות | Matplotlib עם נוצרה ה W3C-לא תקין גרפיקה וקטורית |
| קוד מקור | Python code#Requires [[:wikipedia:matplotlib|matplotlib]]. Due to a bug in wikipedia's SVG renderer,
#the raw files appear with curves peeking outside of the axes.
#Before uploading the files were touched up by releasing and re-setting the clip paths.
from pylab import *
figtype = '.svg'
saveopts = {'bbox_inches':'tight'} #, 'transparent':True, 'frameon':True}
seterr(divide='ignore')
V_fb = concatenate([linspace(9.95,9.95,100, endpoint=False), linspace(9.95,0,101)])
I_fb = concatenate([linspace(0,0.995,100, endpoint=False), linspace(0.995,0.17,101)])
V_cl = concatenate([linspace(10.05,10.05,100, endpoint=False), linspace(10.05,0,101)])
I_cl = concatenate([linspace(0,1.005,100, endpoint=False), linspace(1.005,1.005,101)])
V_nl = linspace(10,10,151)
I_nl = linspace(0,1.5,151)
# Compute powers; Assume regulator is dropping voltage from a source 20% higher than V_oc.
P_cl = I_cl*(V_cl[0]*1.2 - V_cl)
P_fb = I_fb*(V_fb[0]*1.2 - V_fb)
P_nl = I_nl*(V_nl[0]*1.2 - V_nl)
Gcrit = 0.1
Rcrit = 10
Pcrit = 2
### Make V-I curve plot
fig = figure()
ax = axes()
xlim(0,1.7)
ylim(0,12)
ax.set_xlabel('Output current, $I_{\\rm out}$')
ax.set_xticks([I_fb[0], I_fb[-1], max(I_cl), max(I_nl)])
ax.set_xticklabels(['0', '$I_{\\rm SC}$', '$I_{\\rm max}$', '$I_{\\rm damage}$'])
ax.set_ylabel('Output voltage, $V_{\\rm out}$')
ax.set_yticks([0,10])
ax.set_yticklabels(['0', '$V_{\\rm OC}$'])
ax.plot(I_nl, V_nl, 'r', linewidth=2)
ax.plot([I_nl[-1]], [V_nl[-1]], 'r*', linewidth=2)
ax.plot(I_cl, V_cl, 'b', linewidth=2)
ax.plot(I_fb, V_fb, 'g', linewidth=2)
fig.set_size_inches(3,3)
fig.patch.set_alpha(0)
savefig('foldback-vi'+figtype, **saveopts)
### Make power and resistance load plot
fig = figure()
ax = axes()
xlim(0,0.5)
ylim(0,13)
ax.set_xlabel('Load conductance ($\Omega^{-1}$)')
#ax.set_xticks([0,0.1])
#ax.set_xticklabels(['0', '$G_{\\rm crit}$'])
ax.set_ylabel('Regulator heating power (W)')
ax.set_yticks([0,
round(P_fb[100],1),
round(max(P_fb),1),
round(P_fb[-1],1),
round(P_cl[-1],1)])
#ax.set_yticklabels(['0', '$P_{\\rm max,FB}$', '$P_{\\rm SC,FB}$','$P_{\\rm SC,CL}$'])
# Plot heat in regulator vs. conductance
ax.axvline(Gcrit, color='#777777', linestyle='dashed', linewidth=0.5)
ax.axhline(P_fb[-1], color='#777777', linestyle='dashed', linewidth=0.5)
ax.axhline(P_cl[-1], color='#777777', linestyle='dashed', linewidth=0.5)
ax.plot(I_nl/V_nl, P_nl, 'r', linewidth=2)
ax.plot([(I_nl/V_nl)[-1]], [P_nl[-1]], 'r*', linewidth=2)
ax.plot(I_cl/V_cl, P_cl, 'b', linewidth=2)
ax.plot(I_fb/V_fb, P_fb, 'g', linewidth=2)
ax.text(Gcrit/2, 9, 'OK', horizontalalignment='center')
ax.text(0.3, 9, 'Overload', horizontalalignment='center')
fig.set_size_inches(3,3)
fig.patch.set_alpha(0)
savefig('foldback-loadcon'+figtype, **saveopts)
### Make power and conductance load plot
fig = figure()
ax = axes()
xlim(0,16)
ylim(0,13)
ax.set_xlabel('Load resistance ($\Omega$)')
ax.set_xticks([0,5,10,15])
#ax.set_xticklabels(['0', '$G_{\\rm crit}$'])
ax.set_ylabel('Dissipation in regulator (W)')
#ax.set_yticks([0,
# round(P_fb[100],1),
# round(max(P_fb),1),
# round(P_fb[-1],1),
# round(P_cl[-1],1)])
#ax.set_yticklabels(['0', '$P_{\\rm max,FB}$', '$P_{\\rm SC,FB}$','$P_{\\rm SC,CL}$'])
# Plot heat in regulator vs. resistance
amfb = argmax(P_fb)
# grey lines
ax.axvline(Rcrit, color='#777777', linestyle='dashed', linewidth=0.5)
ax.plot([0,V_fb[amfb]/I_fb[amfb]], [P_fb[amfb]]*2, color='#777777', linestyle='dashed', linewidth=0.5)
ax.plot([0,Rcrit],[Pcrit,Pcrit], color='#777777', linestyle='dashed', linewidth=0.5)
#curves
ax.plot(V_nl/I_nl, P_nl, 'r', linewidth=2)
ax.plot([(V_nl/I_nl)[-1]], [P_nl[-1]], 'r*', linewidth=2)
ax.plot(V_cl/I_cl, P_cl, 'b', linewidth=2)
ax.plot(V_fb/I_fb, P_fb, 'g', linewidth=2)
ax.text(Rcrit/2, 12, 'Overloaded', horizontalalignment='center')
ax.text(13, 12, 'Normal', horizontalalignment='center')
fig.set_size_inches(3,3)
fig.patch.set_alpha(0)
savefig('foldback-loadres'+figtype, **saveopts)
|
רישיון
אני, בעל זכויות היוצרים על עבודה זו, מפרסם בזאת את העבודה תחת הרישיון הבא:
| קובץ זה זמין לפי תנאי הקדשה עולמית לנחלת הכלל CC0 1.0 של Creative Commons. | |
| האדם ששייך יצירה להיתר הזה הקדיש את היצירה לנחלת הכלל על־ידי ויתור על כל הזכויות שלו או שלה על היצירה בכל העולם לפי חוק זכויות יוצרים, לרבות כל הזכויות הקשורות או הסמוכות כקבוע בחוק. באפשרותך להעתיק, לשנות, להפיץ, או להציג את היצירה, אפילו למטרות מסחריות, וכל זה אפילו מבלי לבקש רשות.
|
היסטוריית הקובץ
ניתן ללחוץ על תאריך/שעה כדי לראות את הקובץ כפי שנראה באותו זמן.
| תאריך/שעה | תמונה ממוזערת | ממדים | משתמש | הערה | |
|---|---|---|---|---|---|
| נוכחית | 09:41, 2 באוגוסט 2013 | | 276 × 278 (45 ק"ב) | Nanite | labels, transparency |
| 17:17, 1 באוגוסט 2013 |  | 274 × 278 (25 ק"ב) | Nanite | User created page with UploadWizard |
שימוש בקובץ
![]() אין בוויקיפדיה דפים המשתמשים בקובץ זה.
אין בוויקיפדיה דפים המשתמשים בקובץ זה.
שימוש גלובלי בקובץ
אתרי הוויקי השונים הבאים משתמשים בקובץ זה:
- שימוש באתר ca.wikipedia.org
- שימוש באתר en.wikipedia.org
- שימוש באתר fa.wikipedia.org
- שימוש באתר it.wikibooks.org