לדלג לתוכן

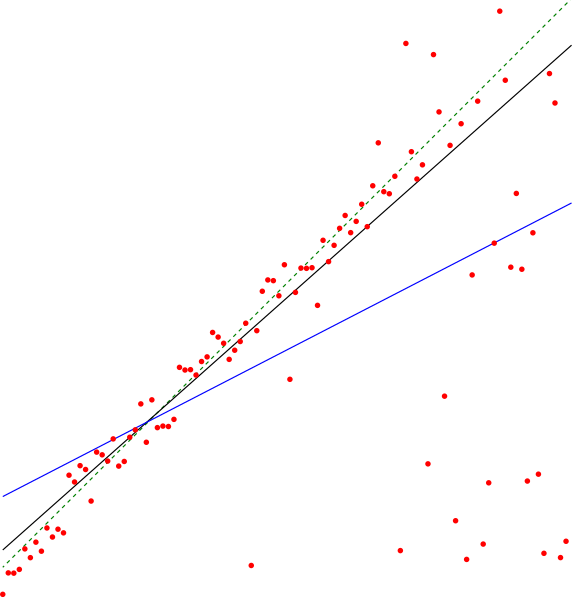
קובץ:Thiel-Sen estimator.svg

תוכן הדף אינו נתמך בשפות אחרות.
מתוך ויקיפדיה, האנציקלופדיה החופשית

לקובץ המקורי(קובץ SVG, הגודל המקורי: 2,936 × 3,075 פיקסלים, גודל הקובץ: 37 ק"ב)

ויקישיתוף זהו קובץ שמקורו במיזם ויקישיתוף. תיאורו בדף תיאור הקובץ המקורי (בעברית) מוצג למטה.

תקציר

תיאור
English: The en:Theil–Sen estimator (black line) of a set of sample points, compared to the simple linear regression line (blue). The points were generated by adding a small amount of jitter to points on the green dashed line and then replacing some of the points by random outliers.
תאריך יצירה
מקור נוצר על־ידי מעלה היצירה
יוצר David Eppstein


רישיון

אני, בעל זכויות היוצרים על עבודה זו, מפרסם בזאת את העבודה תחת הרישיון הבא:
Creative Commons CC-Zero קובץ זה זמין לפי תנאי הקדשה עולמית לנחלת הכלל CC0 1.0 של Creative Commons.
האדם ששייך יצירה להיתר הזה הקדיש את היצירה לנחלת הכלל על־ידי ויתור על כל הזכויות שלו או שלה על היצירה בכל העולם לפי חוק זכויות יוצרים, לרבות כל הזכויות הקשורות או הסמוכות כקבוע בחוק. באפשרותך להעתיק, לשנות, להפיץ, או להציג את היצירה, אפילו למטרות מסחריות, וכל זה אפילו מבלי לבקש רשות.

Source code

This image was created as a pdf file by the following Python code, then converted to SVG.

from pyx import canvas,path,color
from random import random,seed
seed(12345)

N = 103
noise = 10
slope = 1.0

def sample(x):
    y = x * slope
    if random() < (y/N)**3:
        y = random()*N      # outlier
    else:
        y += (random()-0.5)*noise # non-outlier, jitter
    return y

samples = [(i*1.0,sample(i)) for i in range(N)]

c = canvas.canvas()

for x,y in samples:
    c.fill(path.circle(x,y,0.5),[color.rgb.red])

def theilsen(samples):
    N = len(samples)
    def slope(i,j):
        xi,yi = samples[i]
        xj,yj = samples[j]
        return (yi-yj)/(xi-xj)
    
    def median(L):
        L.sort()
        if len(L) & 1:
            return L[len(L)//2]
        else:
            return (L[len(L)//2 - 1] + L[len(L)//2])/2.0
    
    m = median([slope(i,j) for i in range(N) for j in range(i)])
    
    def error(i):
        x,y = samples[i]
        return y - m*x
    
    b = median([error(i) for i in range(N)])
    
    return m,b

m,b = 1,0
c.stroke(path.line(0,b,N,N*m+b),[color.rgb.green])

m,b = theilsen(samples)
c.stroke(path.line(0,b,N,N*m+b),[color.rgb.black])

def slr(samples):
    N = len(samples)
    sumxy = sum([x*y for x,y in samples])
    sumx = sum([x for x,y in samples])
    sumy = sum([y for x,y in samples])
    sumxx = sum([x*x for x,y in samples])
    m = (sumxy - sumx*sumy/N)/(sumxx - sumx**2/N)
    b = sumy/N - m*sumx/N
    return m,b

m,b = slr(samples)
c.stroke(path.line(0,b,N,N*m+b),[color.rgb.blue])

c.writePDFfile("ThielSen")

כיתובים

נא להוסיף משפט שמסביר מה הקובץ מייצג

פריטים שמוצגים בקובץ הזה

מוצג

היסטוריית הקובץ

ניתן ללחוץ על תאריך/שעה כדי לראות את הקובץ כפי שנראה באותו זמן.

תאריך/שעהתמונה ממוזערתממדיםמשתמשהערה
נוכחית21:59, 3 בנובמבר 2011תמונה ממוזערת לגרסה מ־21:59, 3 בנובמבר 2011‪3,075 × 2,936‬ (37 ק"ב)David EppsteinDarker green, thicker lines
02:40, 4 ביולי 2011תמונה ממוזערת לגרסה מ־02:40, 4 ביולי 2011‪3,075 × 2,936‬ (37 ק"ב)David Eppstein{{Information |Description ={{en|1=The en:Theil–Sen estimator (black line) of a set of sample points, compared to the simple linear regression line (blue). The points were generated by adding a small amount of jitter to points on the green dashe

אין בוויקיפדיה דפים המשתמשים בקובץ זה.

שימוש גלובלי בקובץ

אתרי הוויקי השונים הבאים משתמשים בקובץ זה: