
קובץ:T distribution 30df enhanced.svg

גודל התצוגה המקדימה הזאת מסוג PNG של קובץ ה־SVG הזה: 360 × 360 פיקסלים. רזולוציות אחרות: 240 × 240 פיקסלים | 480 × 480 פיקסלים | 768 × 768 פיקסלים | 1,024 × 1,024 פיקסלים | 2,048 × 2,048 פיקסלים.
לקובץ המקורי (קובץ SVG, הגודל המקורי: 360 × 360 פיקסלים, גודל הקובץ: 67 ק"ב)
| זהו קובץ שמקורו במיזם ויקישיתוף. תיאורו בדף תיאור הקובץ המקורי (בעברית) מוצג למטה. |
תקציר
| תיאור |
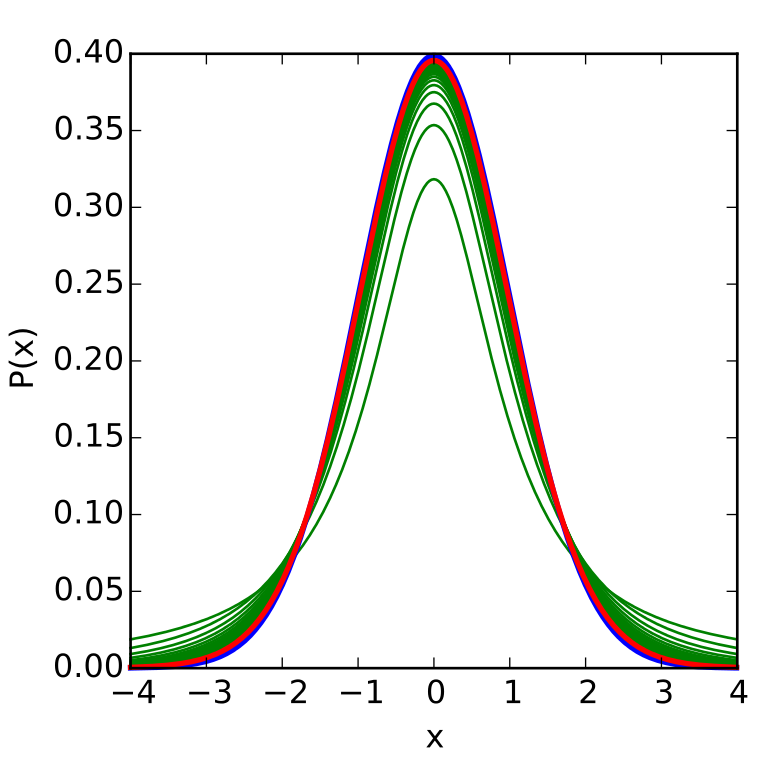
English: Student's t-distribution with 30 degrees of freedom. Enhanced imaging |
| תאריך יצירה | |
| מקור | נוצר על־ידי מעלה היצירה |
| יוצר | IkamusumeFan |
| SVGהתפתחות | Matplotlib עם נוצרה ה גרפיקה וקטורית |
Plot using Python Matplotlib.
רישיון
אני, בעל זכויות היוצרים על עבודה זו, מפרסם בזאת את העבודה תחת הרישיון הבא:
הקובץ הזה מתפרסם לפי תנאי רישיון קריאייטיב קומונז ייחוס-שיתוף זהה 3.0 לא מותאם.
- הנכם רשאים:
- לשתף – להעתיק, להפיץ ולהעביר את העבודה
- לערבב בין עבודות – להתאים את העבודה
- תחת התנאים הבאים:
- ייחוס – יש לתת ייחוס הולם, לתת קישור לרישיון, ולציין אם נעשו שינויים. אפשר לעשות את זה בכל צורה סבירה, אבל לא בשום צורה שמשתמע ממנה שמעניק הרישיון תומך בך או בשימוש שלך.
- שיתוף זהה – אם תיצרו רמיקס, תשנו, או תבנו על החומר, חובה עליכם להפיץ את התרומות שלך לפי תנאי רישיון זהה או תואם למקור.
Python (Matplotlib)
import numpy as np
import matplotlib.pyplot as plt
import scipy.special as sp

X = np.arange(-4, 4, 0.01)	# range of the graph

plt.clf()
plt.figure(figsize=(4,4))
plt.axes([0.17,0.13,0.79,0.8])
plt.hold(True)

Q = []	# No curves at first.

# Draw the previous Student's t-distributions
nu = 30	# freedom degree = 30
for previous_nu in range(1,nu):
	mu = 0	# mean = 0
	A = np.exp(sp.gammaln((previous_nu+1)/2.0));
	B = np.exp(sp.gammaln(previous_nu/2.0))*np.sqrt(previous_nu*np.pi);
	C = (1+X*X/previous_nu)**(-(previous_nu+1)/2.0);
	Y = A*C/B;
	a = plt.plot(X, Y, '-', color='green', lw=1)
	Q.append(a)

# Draw the curve of Normal distribution
mu = 0	# mean = 0
sigma = 1	# variance = 1
A = 1/(sigma*np.sqrt(2*np.pi))
B = np.exp(-(X-mu)*(X-mu)/(2*sigma*sigma));
Y = A*B
a = plt.plot(X, Y, '-', color='blue', lw=2)
Q.append(a)

# Draw the curve of Student's t-distribution
mu = 0	# mean = 0
A = np.exp(sp.gammaln((nu+1)/2.0));
B = np.exp(sp.gammaln(nu/2.0))*np.sqrt(nu*np.pi);
C = (1+X*X/nu)**(-(nu+1)/2.0);
Y = A*C/B;
a = plt.plot(X, Y, '-', color='red', lw=2)
Q.append(a)

# Remaining steps to finish drawing the graph.
plt.xlabel("x")
plt.ylabel("P(x)")
plt.xlim(-4,4)

# Saving the output.
plt.savefig("T_distribution_1df.pdf")
plt.savefig("T_distribution_1df.eps")
plt.savefig("T_distribution_1df.svg")
היסטוריית הקובץ
ניתן ללחוץ על תאריך/שעה כדי לראות את הקובץ כפי שנראה באותו זמן.
| תאריך/שעה | תמונה ממוזערת | ממדים | משתמש | הערה | |
|---|---|---|---|---|---|
| נוכחית | 12:10, 29 באפריל 2016 | | 360 × 360 (67 ק"ב) | IkamusumeFan | revise based on discussions |
| 07:55, 21 ביולי 2013 |  | 360 × 360 (86 ק"ב) | IkamusumeFan | The previous edition is wrong on the degrees of freedom. | |
| 07:26, 21 ביולי 2013 |  | 360 × 360 (86 ק"ב) | IkamusumeFan | Thicker lines for visibility. | |
| 07:16, 21 ביולי 2013 |  | 360 × 360 (86 ק"ב) | IkamusumeFan | User created page with UploadWizard |
שימוש בקובץ
![]() אין בוויקיפדיה דפים המשתמשים בקובץ זה.
אין בוויקיפדיה דפים המשתמשים בקובץ זה.
שימוש גלובלי בקובץ
אתרי הוויקי השונים הבאים משתמשים בקובץ זה:
- שימוש באתר ca.wikipedia.org
- שימוש באתר el.wikipedia.org
- שימוש באתר en.wikipedia.org
- שימוש באתר ru.wikipedia.org
- שימוש באתר sr.wikipedia.org
- שימוש באתר zh.wikipedia.org