לדלג לתוכן

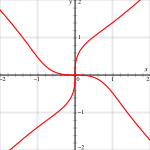
קובץ:Swastica curve3.png

תוכן הדף אינו נתמך בשפות אחרות.
מתוך ויקיפדיה, האנציקלופדיה החופשית

Swastica_curve3.png(587 × 579 פיקסלים, גודל הקובץ: 19 ק"ב, סוג MIME‏: image/png)

ויקישיתוף זהו קובץ שמקורו במיזם ויקישיתוף. תיאורו בדף תיאור הקובץ המקורי (בעברית) מוצג למטה.
תיאור The swastika curve
תאריך יצירה (UTC)
מקור self-made with MATLAB.
יוצר Oleg Alexandrov
Public domain ברצוני, בעלי זכויות היוצרים על יצירה זו, לשחרר יצירה זו לנחלת הכלל. זה תקף בכל העולם.
יש מדינות שבהן הדבר אינו אפשרי על פי חוק, אם כך:
אני מעניק לכל אחד את הזכות להשתמש בעבודה זו לכל מטרה שהיא, ללא תנאים כלשהם, אלא אם כן תנאים כאלה נדרשים על פי חוק.
קיימת תמונה חדשה תמונה זו בגרסה וקטורית בפורמט "SVG". יש להחליף את התמונה הנוכחית בתמונה החדשה.

File:Swastica curve3.png → File:Swastika curve.svg


בשפות אחרות
Alemannisch  Bahasa Indonesia  Bahasa Melayu  British English  català  čeština  dansk  Deutsch  eesti  English  español  Esperanto  euskara  français  Frysk  galego  hrvatski  Ido  italiano  lietuvių  magyar  Nederlands  norsk bokmål  norsk nynorsk  occitan  Plattdüütsch  polski  português  português do Brasil  română  Scots  sicilianu  slovenčina  slovenščina  suomi  svenska  Tiếng Việt  Türkçe  vèneto  Ελληνικά  беларуская (тарашкевіца)  български  македонски  нохчийн  русский  српски / srpski  татарча/tatarça  українська  ქართული  հայերեն  বাংলা  தமிழ்  മലയാളം  ไทย  한국어  日本語  简体中文  繁體中文  עברית  العربية  فارسی  +/−
New SVG image

MATLAB source code

% Swastika curve

function main()

   % linewidth and font size
   lw= 4; 
   fs = 25;

% colors
   red=[0.867 0.06 0.14];
   blue = [0, 129, 205]/256;
   green = [0, 200,  70]/256;
   black = [0, 0, 0];
   white = 0.99*[1, 1, 1];

   % Set up the plotting window
   figure(1); clf; set(gca, 'fontsize', fs, 'linewidth', lw/4);
   hold on; axis equal; grid on;

   N=500;  % number of points (don't make it big, code will be slow)
   Lx1 = -2; Lx2 = 2; Ly1 = -2; Ly2 = 2;
   
   [X, Y]=meshgrid(linspace(Lx1, Lx2, N), linspace(Ly1, Ly2, N));   % X and Y coordinates

   Ncurves = 10;
   A = linspace(0, 1, Ncurves);

   figure(2); clf; hold on; axis equal; axis off;

   x = X; y = Y;
   Z = y.^4-x.^4-x.*y;
          
%  graph the curves using 'contour' in figure (2)
   figure(2); [c, stuff] = contour(X, Y, Z, [0, 0]);
          
%  extract the curves from c and graph them in figure(1) using 'plot'
%  need to do this kind of convoluted work since plot2svg can't save
%  the result of 'contour' but can save the result of 'plot'   
          
   [m, n] = size(c);
   while n > 0
          
          l=c(2, 1);
          x=c(1,2:(l+1));  y=c(2,2:(l+1)); % get x and y of contours
          figure(1); plot(x, y, 'color', red, 'linewidth', lw);
          
          c = c(:, (l+2):n);
          [m, n] = size(c);
                 
   end
   
   figure(1); axis equal; axis ([Lx1, Lx2, Ly1, Ly2]);

   set(gca, 'XTick', [-2, -1, 0, 1, 2]);  set(gca, 'YTick', [-2, -1, 0, 1, 2]);
   set(gca, 'GridLineStyle', '--');
   
   saveas(gcf, 'Swastica_curve3.eps', 'psc2')

כיתובים

נא להוסיף משפט שמסביר מה הקובץ מייצג

פריטים שמוצגים בקובץ הזה

מוצג

היסטוריית הקובץ

ניתן ללחוץ על תאריך/שעה כדי לראות את הקובץ כפי שנראה באותו זמן.

תאריך/שעהתמונה ממוזערתממדיםמשתמשהערה
נוכחית09:49, 17 בינואר 2008תמונה ממוזערת לגרסה מ־09:49, 17 בינואר 2008‪579 × 587‬ (19 ק"ב)Oleg AlexandrovTweak
09:46, 17 בינואר 2008תמונה ממוזערת לגרסה מ־09:46, 17 בינואר 2008‪579 × 587‬ (20 ק"ב)Oleg Alexandrovx and y labels
08:56, 17 בינואר 2008תמונה ממוזערת לגרסה מ־08:56, 17 בינואר 2008‪558 × 549‬ (19 ק"ב)Oleg Alexandrovmake curve thicker
08:54, 17 בינואר 2008תמונה ממוזערת לגרסה מ־08:54, 17 בינואר 2008‪558 × 549‬ (20 ק"ב)Oleg Alexandrov{{Information |Description=The en:swastica curve |Source=self-made with en:Matlab. |Date=~~~~~ |Author= Oleg Alexandrov }} {{PD-self}} ==MATLAB source code== <source lang="matlab"> % Swastika curve function main()

אין בוויקיפדיה דפים המשתמשים בקובץ זה.