
קובץ:Scalloping and noise floor comparisons (2 window functions).png
אין גרסה ברזולוציה גבוהה יותר.
Scalloping_and_noise_floor_comparisons_(2_window_functions).png (562 × 457 פיקסלים, גודל הקובץ: 22 ק"ב, סוג MIME: image/png)
| זהו קובץ שמקורו במיזם ויקישיתוף. תיאורו בדף תיאור הקובץ המקורי (בעברית) מוצג למטה. |
תקציר
| תיאור |
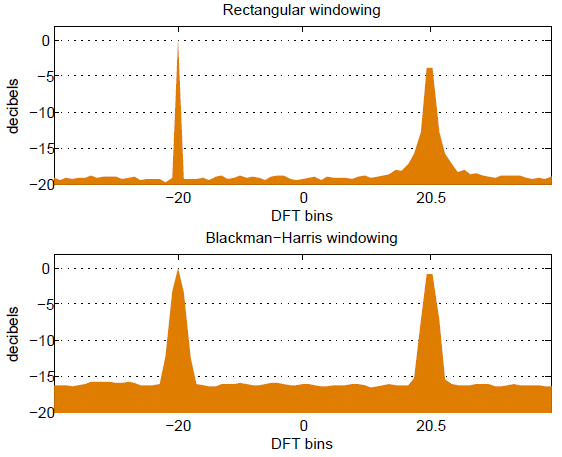
English: Comparison of two window functions in terms of their effects on equal-strength sinusoids with additive noise. The noise "floor" is smoothed by averaging many DFTs to reveal the substantial difference in levels, caused by the different window functions. The sinusoid at bin -20 suffers no scalloping and the one at bin +20.5 exhibits worst-case scalloping. The rectangular window produces the most scalloping but also narrower peaks and lower noise-floor. A third sinusoid with amplitude -16 dB would be noticeable in the upper spectrum, but not in the lower spectrum. |
|||
| תאריך יצירה | ||||
| מקור | נוצר על־ידי מעלה היצירה | |||
| יוצר | Bob K | |||
| אישורים והיתרים (שימוש חוזר בקובץ זה) |
אני, בעל זכויות היוצרים על עבודה זו, מפרסם בזאת את העבודה תחת הרישיון הבא:
|
|||
| גרסאות אחרות |
Derivative works of this file:
|
|||
| Script | Matlab codeN = 256; % sams_per_fft;
window1 = rectwin(N)'/sum(rectwin(N));
window2 = blackmanharris(N)'/sum(blackmanharris(N));
%
Fs = N; % sams_per_sec;
HzPerBin = Fs/N;
F1 = -20.0*HzPerBin; % bin -20
F2 = +20.5*HzPerBin; % bin 20.5
%
L = 100000;
n = 1:L;
x = exp(j*2*pi*F1/Fs*n) + exp(j*2*pi*F2/Fs*n);
x = x + (randn(1,L) +j*randn(1,L))*1.4;
%
sams_per_offset = 0.75*N; % overlap = 25%
%
% number of samples available beyond just one FFT
excess_sams = length(x) - N;
%
j1 = floor( excess_sams / sams_per_offset );
sams_per_offset = floor( excess_sams / j1 );
num_ffts = 1 + j1;
%
% define the first block of data
samples = 1:N;
%
amplitude1 = zeros(1,N);
amplitude2 = zeros(1,N);
%
% Loop over all the available blocks
for j1 = 1 : num_ffts
amplitude1 = amplitude1 + abs(fft( x(samples) .* window1 ));
amplitude2 = amplitude2 + abs(fft( x(samples) .* window2 ));
samples = samples + sams_per_offset;
end
%
warning off MATLAB:log:logOfZero
amplitude1 = 20*log10(fftshift(amplitude1/num_ffts));
amplitude2 = 20*log10(fftshift(amplitude2/num_ffts));
%
abscissa = -40:40;
figure
subplot(2,1,1); h = area(abscissa, amplitude1(abscissa +N/2+1), ...
'FaceColor', [.871 .49 0], 'Linestyle', 'none')
set(h,'BaseValue',-20)
xlim([-40 40])
ylim([-20 2])
set(gca,'XTick', [-20 0 20.5])
set(gca,'YGrid','on')
xlabel('DFT bins')
ylabel('decibels')
title('Rectangular windowing');
%
subplot(2,1,2); h = area(abscissa, amplitude2(abscissa +N/2+1), ...
'FaceColor', [.871 .49 0], 'Linestyle', 'none')
set(h,'BaseValue',-20)
xlim([-40 40])
ylim([-20 2])
set(gca,'XTick', [-20 0 20.5])
set(gca,'YGrid','on')
xlabel('DFT bins')
ylabel('decibels')
title('Blackman-Harris windowing');
|


.png)
.png?uselang=he)
היסטוריית הקובץ
ניתן ללחוץ על תאריך/שעה כדי לראות את הקובץ כפי שנראה באותו זמן.
| תאריך/שעה | תמונה ממוזערת | ממדים | משתמש | הערה | |
|---|---|---|---|---|---|
| נוכחית | 20:46, 19 בדצמבר 2011 | | 457 × 562 (22 ק"ב) | Bob K | Change graph format to area fill to highlight noise floor comparison. |
| 19:52, 19 בדצמבר 2011 |  | 461 × 572 (24 ק"ב) | Bob K |
שימוש בקובץ
![]() אין בוויקיפדיה דפים המשתמשים בקובץ זה.
אין בוויקיפדיה דפים המשתמשים בקובץ זה.
שימוש גלובלי בקובץ
אתרי הוויקי השונים הבאים משתמשים בקובץ זה:
- שימוש באתר en.wikipedia.org
.png)