
קובץ:Quasiconvex function.png
אין גרסה ברזולוציה גבוהה יותר.
Quasiconvex_function.png (501 × 358 פיקסלים, גודל הקובץ: 11 ק"ב, סוג MIME: image/png)
| זהו קובץ שמקורו במיזם ויקישיתוף. תיאורו בדף תיאור הקובץ המקורי (בעברית) מוצג למטה. |
תקציר

|
יש ליצור מחדש את התמונה graph הזו באמצעות גרפיקה וקטורית כדוגמת קובץ SVG. לפעולה זו מספר יתרונות, כפי שניתן לקרוא (באנגלית) בדף Commons:Media for cleanup. אם ברשותכם קובץ SVG, אנא העלו אותו. לאחר מכן, החליפו תבנית זו בתבנית
{{vector version available|שם הקובץ.svg}} |
| תיאור |
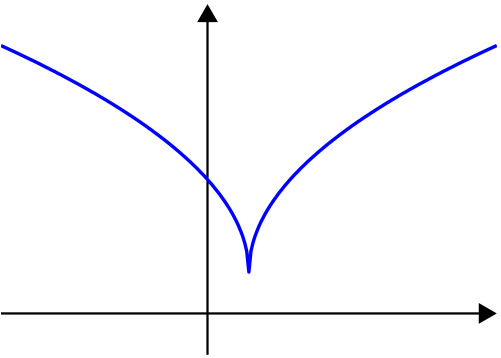
English: Quasiconvex function |
| מקור | נוצר על־ידי מעלה היצירה, created by myself with MATLAB. |
| יוצר | user:Oleg Alexandrov |
רישיון
| ברצוני, בעלי זכויות היוצרים על יצירה זו, לשחרר יצירה זו לנחלת הכלל. זה תקף בכל העולם. יש מדינות שבהן הדבר אינו אפשרי על פי חוק, אם כך: אני מעניק לכל אחד את הזכות להשתמש בעבודה זו לכל מטרה שהיא, ללא תנאים כלשהם, אלא אם כן תנאים כאלה נדרשים על פי חוק. |
Source code (MATLAB)
function main()

% prepare the scrreen and define some parameters
clf; hold on; axis equal; axis off;
fontsize=25; thick_line=3; thin_line=2; black=[0, 0, 0]; red=[1, 0, 0];
arrowsize=0.1; arrow_type=1; arrow_angle=30; % (angle in degrees)

L=1;

X=(-L):0.01:(L+0.4);
Y=sqrt(abs(X-0.2))+0.2;

arrow([-L 0], [L+0.4, 0],          thin_line, arrowsize, arrow_angle, arrow_type, black)
arrow([0 min(Y)-0.4], [0 max(Y)+0.2], thin_line, arrowsize, arrow_angle, arrow_type, black)
plot(X, Y, 'linewidth', thick_line)

saveas(gcf, 'Quasiconvex_function.eps', 'psc2') % export to eps


function arrow(start, stop, thickness, arrow_size, sharpness, arrow_type, color)

% Function arguments:
% start, stop:  start and end coordinates of arrow, vectors of size 2
% thickness:    thickness of arrow stick
% arrow_size:   the size of the two sides of the angle in this picture ->
% sharpness:    angle between the arrow stick and arrow side, in degrees
% arrow_type:   1 for filled arrow, otherwise the arrow will be just two segments
% color:        arrow color, a vector of length three with values in [0, 1]

% convert to complex numbers
   i=sqrt(-1);
   start=start(1)+i*start(2); stop=stop(1)+i*stop(2);
   rotate_angle=exp(i*pi*sharpness/180);

% points making up the arrow tip (besides the "stop" point)
   point1 = stop - (arrow_size*rotate_angle)*(stop-start)/abs(stop-start);
   point2 = stop - (arrow_size/rotate_angle)*(stop-start)/abs(stop-start);

   if arrow_type==1 % filled arrow

      % plot the stick, but not till the end, looks bad
      t=0.5*arrow_size*cos(pi*sharpness/180)/abs(stop-start); stop1=t*start+(1-t)*stop;
      plot(real([start, stop1]), imag([start, stop1]), 'LineWidth', thickness, 'Color', color);

      % fill the arrow
      H=fill(real([stop, point1, point2]), imag([stop, point1, point2]), color);
      set(H, 'EdgeColor', 'none')

   else % two-segment arrow
      plot(real([start, stop]), imag([start, stop]),   'LineWidth', thickness, 'Color', color);
      plot(real([stop, point1]), imag([stop, point1]), 'LineWidth', thickness, 'Color', color);
      plot(real([stop, point2]), imag([stop, point2]), 'LineWidth', thickness, 'Color', color);
   end
|
|
יש ליצור מחדש את התמונה math הזו באמצעות גרפיקה וקטורית כדוגמת קובץ SVG. לפעולה זו מספר יתרונות, כפי שניתן לקרוא (באנגלית) בדף Commons:Media for cleanup. אם ברשותכם קובץ SVG, אנא העלו אותו. לאחר מכן, החליפו תבנית זו בתבנית
{{vector version available|שם הקובץ.svg}} |
היסטוריית הקובץ
ניתן ללחוץ על תאריך/שעה כדי לראות את הקובץ כפי שנראה באותו זמן.
| תאריך/שעה | תמונה ממוזערת | ממדים | משתמש | הערה | |
|---|---|---|---|---|---|
| נוכחית | 22:33, 27 בינואר 2007 | | 358 × 501 (11 ק"ב) | Oleg Alexandrov | Created by myself with MATLAB. |
שימוש בקובץ
![]() אין בוויקיפדיה דפים המשתמשים בקובץ זה.
אין בוויקיפדיה דפים המשתמשים בקובץ זה.
שימוש גלובלי בקובץ
אתרי הוויקי השונים הבאים משתמשים בקובץ זה:
- שימוש באתר de.wikipedia.org
- שימוש באתר en.wikipedia.org
- שימוש באתר fa.wikipedia.org
- שימוש באתר fr.wikipedia.org
- שימוש באתר jbo.wikipedia.org
- שימוש באתר pt.wikipedia.org
- שימוש באתר ru.wikipedia.org
- שימוש באתר uk.wikipedia.org
- שימוש באתר zh.wikipedia.org