
קובץ:QHO-coherentstate3-animation-color.gif
אין גרסה ברזולוציה גבוהה יותר.
QHO-coherentstate3-animation-color.gif (300 × 200 פיקסלים, גודל הקובץ: 449 ק"ב, סוג MIME: image/gif, בלולאה, 150 תמונות, 7.5 שניות)
| זהו קובץ שמקורו במיזם ויקישיתוף. תיאורו בדף תיאור הקובץ המקורי (בעברית) מוצג למטה. |
תקציר
| תיאור |
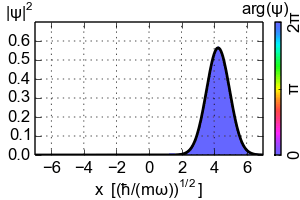
English: Animation of the quantum wave function of a coherent state of initial α=3 in a Quantum harmonic oscillator. The probability distribution is drawn along the ordinate, while the phase is encoded by color. The gaussian wave packet oscillates sinusoidally in the harmonic potential. |
| תאריך יצירה | |
| מקור |
נוצר על־ידי מעלה היצירה . Matplotlib עם נוצרה ה GIF תמונת מפת סיביות |
| יוצר | Geek3 |
| גרסאות אחרות | QHO-coherentstate3-animation.gif |
Source Code
The plot was generated with Matplotlib.
| Python Matplotlib source code |
|---|
#!/usr/bin/python
# -*- coding: utf8 -*-

from math import *
import matplotlib.pyplot as plt
from matplotlib import animation, colors, colorbar
import numpy as np
import colorsys
from scipy.interpolate import interp1d
import os, sys

plt.rc('path', snap=False)
plt.rc('mathtext', default='regular')

# image settings
fname = 'QHO-coherentstate3-animation-color'
width, height = 300, 200
ml, mr, mt, mb, mh, mc = 35, 19, 22, 45, 12, 6
x0, x1 = -7, 7
y0, y1 = 0.0, 0.7
nframes = 150
fps = 20

# physics settings
alpha0 = 3.0
omega = 2*pi

def color(phase):
    hue = (phase / (2*pi) + 2./3.) % 1
    light = interp1d([0, 1, 2, 3, 4, 5, 6], # adjust lightness
                     [0.64, 0.5, 0.55, 0.48, 0.70, 0.57, 0.64])(6 * hue)
    hls = (hue, light, 1.0) # maximum saturation
    rgb = colorsys.hls_to_rgb(*hls)
    return rgb

def coherent(alpha0, x, omega_t):
    # Definition of coherent states
    # https://en.wikipedia.org/wiki/Coherent_states
    alpha = alpha0 * e**(-1j * omega_t)
    psi = pi**-0.25 * np.exp(-0.5j * omega_t
                - 0.5 * ((x - sqrt(2) * alpha.real))**2
                - 1j * alpha.imag * (alpha.real - sqrt(2) * x))
    return psi

def animate(nframe):
    print str(nframe) + ' ',; sys.stdout.flush()
    t = float(nframe) / nframes # animation repeats after t=1.0

    ax.cla()
    ax.grid(True)
    ax.axis((x0, x1, y0, y1))

    x = np.linspace(x0, x1, int(ceil(1+w_px)))
    x2 = x - px_w/2.

    # Let's cheat a bit: add a phase phi(t)*const(x)
    # This will reduce the period from T=2*(2pi/omega) to T=1.0*(2pi/omega)
    # and allow fewer frames and less file size for repetition.
    # For big alpha the change is hardly visible
    psi = coherent(alpha0, x, omega * t) * np.exp(-0.5j * omega * t)
    psi2 = coherent(alpha0, x2, omega * t) * np.exp(-0.5j * omega * t)

    y = np.abs(psi)**2
    phi = np.angle(psi2)

    # plot color filling
    for x_, phi_, y_ in zip(x, phi, y):
        ax.plot([x_, x_], [0, y_], color=color(phi_), lw=2*0.72)

    ax.plot(x, y, lw=2, color='black')
    ax.set_yticklabels([l for l in ax.get_yticks() if l < y0+0.9*(y1-y0)])


# create figure and axes
plt.close('all')
fig, ax = plt.subplots(1, figsize=(width/100., height/100.))
bounds = [float(ml)/width, float(mb)/height,
          1.0 - float(mr+mc+mh)/width, 1.0 - float(mt)/height]
fig.subplots_adjust(left=bounds[0], bottom=bounds[1],
                    right=bounds[2], top=bounds[3], hspace=0)
w_px = width - (ml+mr+mh+mc) # plot width in pixels
px_w = float(x1 - x0) / w_px # width of one pixel in plot units

# axes labels
fig.text(0.5 + 0.5 * float(ml-mh-mc-mr)/width, 4./height,
         r'$x\ \ [(\hbar/(m\omega))^{1/2}]$', ha='center')
fig.text(5./width, 1.0, '$|\psi|^2$', va='top')

# colorbar for phase
cax = fig.add_axes([1.0 - float(mr+mc)/width, float(mb)/height,
                    float(mc)/width, 1.0 - float(mb+mt)/height])
cax.yaxis.set_tick_params(length=2)
cmap = colors.ListedColormap([color(phase) for phase in
                              np.linspace(0, 2*pi, 384, endpoint=False)])
norm = colors.Normalize(0, 2*pi)
cbar = colorbar.ColorbarBase(cax, cmap=cmap, norm=norm,
                    orientation='vertical', ticks=np.linspace(0, 2*pi, 3))
cax.set_yticklabels(['$0$', r'$\pi$', r'$2\pi$'], rotation=90)
fig.text(1.0 - 10./width, 1.0, '$arg(\psi)$', ha='right', va='top')
plt.sca(ax)

# start animation
if 0 != os.system('convert -version > ' +  os.devnull):
    print 'imagemagick not installed!'
    # warning: imagemagick produces somewhat jagged and therefore large gifs
    anim = animation.FuncAnimation(fig, animate, frames=nframes)
    anim.save(fname + '.gif', writer='imagemagick', fps=fps)
else:
    # unfortunately the matplotlib imagemagick backend does not support
    # options which are necessary to generate high quality output without
    # framewise color palettes. Therefore save all frames and convert then.
    if not os.path.isdir(fname):
        os.mkdir(fname)
    fnames = []

    for frame in range(nframes):
        animate(frame)
        imgname = os.path.join(fname, fname + '{:03d}'.format(frame) + '.png')
        fig.savefig(imgname)
        fnames.append(imgname)

    # compile optimized animation with ImageMagick
    cmd = 'convert -loop 0 -delay ' + str(100 / fps) + ' '
    cmd += ' '.join(fnames) # now create optimized palette from all frames
    cmd += r' \( -clone 0--1 \( -clone 0--1 -fill black -colorize 100% \) '
    cmd += '-append +dither -colors 255 -unique-colors '
    cmd += '-write mpr:colormap +delete \) +dither -map mpr:colormap '
    cmd += '-alpha activate -layers OptimizeTransparency '
    cmd += fname + '.gif'
    os.system(cmd)

    for fnamei in fnames:
        os.remove(fnamei)
    os.rmdir(fname)
|
רישיון
אני, בעל זכויות היוצרים על היצירה הזאת, מפרסם אותה בזאת תחת הרישיונות הבאים:

|
מוענקת בכך הרשות להעתיק, להפיץ או לשנות את המסמך הזה, לפי תנאי הרישיון לשימוש חופשי במסמכים של גנו, גרסה 1.2 או כל גרסה מאוחרת יותר שתפורסם על־ידי המוסד לתוכנה חופשית; ללא פרקים קבועים, ללא טקסט עטיפה קדמית וללא טקסט עטיפה אחורית. עותק של הרישיון כלול בפרק שכותרתו הרישיון לשימוש חופשי במסמכים של גנו. |
הקובץ הזה מתפרסם לפי תנאי רישיון קריאייטיב קומונז ייחוס 3.0 לא מותאם.
- הנכם רשאים:
- לשתף – להעתיק, להפיץ ולהעביר את העבודה
- לערבב בין עבודות – להתאים את העבודה
- תחת התנאים הבאים:
- ייחוס – יש לתת ייחוס הולם, לתת קישור לרישיון, ולציין אם נעשו שינויים. אפשר לעשות את זה בכל צורה סבירה, אבל לא בשום צורה שמשתמע ממנה שמעניק הרישיון תומך בך או בשימוש שלך.
הנכם מוזמנים לבחור את הרישיון הרצוי בעיניכם.
היסטוריית הקובץ
ניתן ללחוץ על תאריך/שעה כדי לראות את הקובץ כפי שנראה באותו זמן.
| תאריך/שעה | תמונה ממוזערת | ממדים | משתמש | הערה | |
|---|---|---|---|---|---|
| נוכחית | 00:42, 11 באוקטובר 2015 | | 200 × 300 (449 ק"ב) | Geek3 | better compression |
| 16:26, 4 באוקטובר 2015 |  | 200 × 300 (603 ק"ב) | Geek3 | legend added | |
| 01:04, 21 בספטמבר 2015 |  | 200 × 300 (608 ק"ב) | Geek3 | {{Information |Description ={{en|1=Animation of the quantum wave function of a Schrödinger cat state of α=3 in a Quantum harmonic oscillator. The [[:en:Probability distrib... |
שימוש בקובץ
![]() אין בוויקיפדיה דפים המשתמשים בקובץ זה.
אין בוויקיפדיה דפים המשתמשים בקובץ זה.
שימוש גלובלי בקובץ
אתרי הוויקי השונים הבאים משתמשים בקובץ זה:
- שימוש באתר de.wikipedia.org
- שימוש באתר de.wikibooks.org
- שימוש באתר en.wikipedia.org
- שימוש באתר uk.wikipedia.org