
קובץ:Operating systems used on top 500 supercomputers.svg

גודל התצוגה המקדימה הזאת מסוג PNG של קובץ ה־SVG הזה: 800 × 480 פיקסלים. רזולוציות אחרות: 320 × 192 פיקסלים | 1,024 × 614 פיקסלים | 1,280 × 768 פיקסלים | 2,560 × 1,536 פיקסלים | 1,200 × 720 פיקסלים.
לקובץ המקורי (קובץ SVG, הגודל המקורי: 1,200 × 720 פיקסלים, גודל הקובץ: 47 ק"ב)
| זהו קובץ שמקורו במיזם ויקישיתוף. תיאורו בדף תיאור הקובץ המקורי (בעברית) מוצג למטה. |
תקציר
| תיאור |
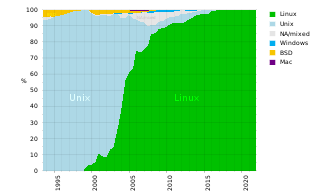
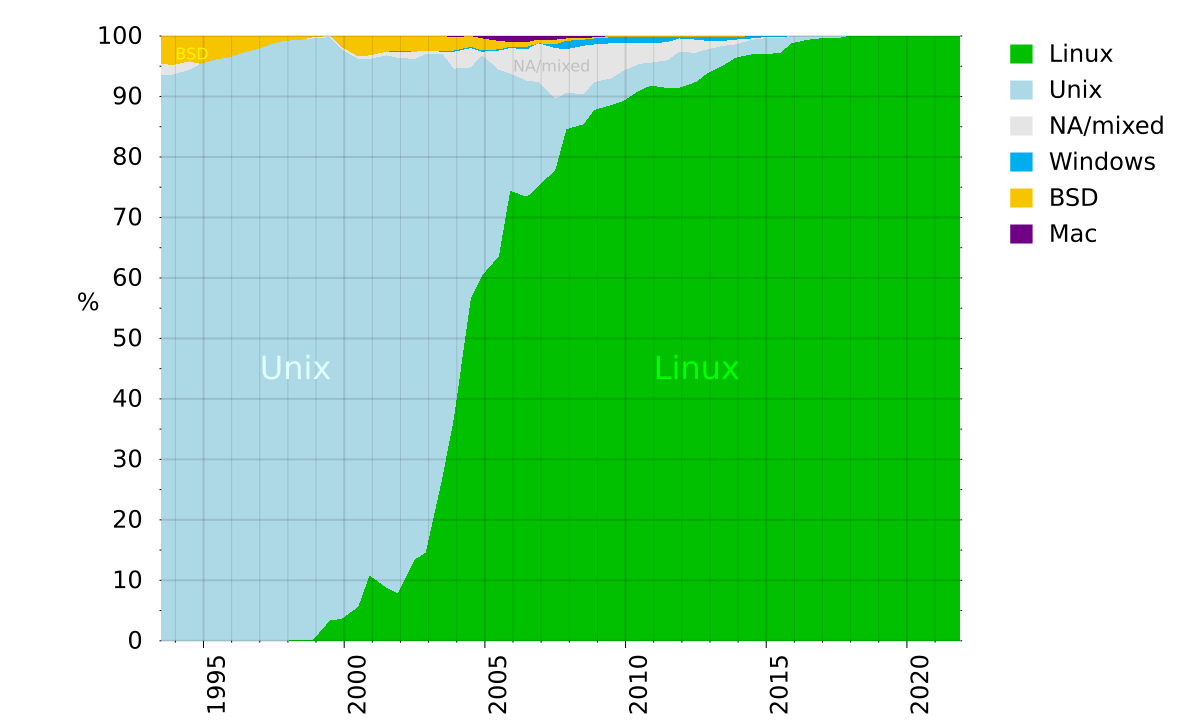
English: This figure shows the operating systems used on the supercomputers listed on the Top500 list. Data for this figure was compiled from http://top500.org/stats |
| תאריך יצירה | |
| מקור | Eigenes Werk (own work) / source top500.org |
| יוצר | Benedikt.Seidl |
| גרסאות אחרות |
Derivative works of this file: Operating systems used on top 500 supercomputers de.svg Image:Top500_OS.png |
רישיון
| ברצוני, בעלי זכויות היוצרים על יצירה זו, לשחרר יצירה זו לנחלת הכלל. זה תקף בכל העולם. יש מדינות שבהן הדבר אינו אפשרי על פי חוק, אם כך: אני מעניק לכל אחד את הזכות להשתמש בעבודה זו לכל מטרה שהיא, ללא תנאים כלשהם, אלא אם כן תנאים כאלה נדרשים על פי חוק. |
W3C-validity not checked.
Verwendetes Script für Gnuplot
#!/usr/bin/gnuplot
#
# Gnuplot Script zur Erstellung des SVG-Dokuments
#

unset border

# using native size of 1200 * 720 = (2*2*2*2*3*5*5) * (2*2*2*2*3*3*5)
# so that size can be divided by 1, 2, 3, 4, 5, 6, 8, 10, 12, 15, 16, 20, 24, 30, 40, 48, 60, 80, 120, 240 without aliasing
set terminal svg size 1200 720 fname "DejaVu Sans,24" enhanced
set output "Operating_systems_used_on_top_500_supercomputers.svg"

set ylabel rotate by 0 "%" offset 3,1.0
set key invert reverse Left outside samplen 0.2
set xtics out  scale 0.4,0.1  rotate by 90 offset 0.8,character -1.4  1990,5,2038  nomirror
set ytics out  scale 0.1,0.1  0,10,100
set mxtics 5
set mytics 2
show mxtics
show mytics

set yrange [0:100]

set grid xtics mxtics ytics  front \
    linetype 3 linewidth 2 lc rgb "#e0000000",\
    linetype 3 linewidth 1 lc rgb "#e0000000"
show grid

set label "Unix"     at 1997,45 front font ",32" textcolor "light-cyan"
set label "Linux"    at 2011,45 front font ",32" textcolor "green"
set label "NA/mixed" at 2006,95 front font ",16" textcolor "grey95"
set label "BSD"      at 1994,97 front font ",16" textcolor "#fef000"
show label

plot \
'cpu.csv' using 1:(100-$7)      :(100)         title "Mac"      with filledcurves lt rgb "#6f0085" ,\
       '' using 1:($2+$4+$6+$3) :(100-$7)      title "BSD"      with filledcurves lt rgb "#f7c500" ,\
       '' using 1:($2+$4+$6)    :($2+$4+$6+$3) title "Windows"  with filledcurves lt rgb "#00adef" ,\
       '' using 1:($2+$4)       :($2+$4+$6)    title "NA/mixed" with filledcurves lt rgb "grey90" ,\
       '' using 1:($2)          :($2+$4)       title "Unix"     with filledcurves lt rgb "light-blue" ,\
       '' using 1:(0)           :($2)          title "Linux"    with filledcurves lt rgb "web-green"


#
# output same data with lines instead of filledcurves, plot two diagram in one
#
set output "Operating_systems_used_on_top_500_supercomputers_detail.svg"
set multiplot

#
# top plot
set size   1, 0.4
set origin 0, 0.6

set border
set bmargin 0.5

set yrange [0:100]

set xtics out  scale 0.5,0.3  rotate by 90 offset 0.8,character -1.4  1990,5,2038  nomirror
set ytics out  scale 0.2,0.2  0,20,100

# do not plot years in top plot
set format x ""
# do not plot legend in top plot
set key off
# use fixed width for y
set format y "%3g"

set ylabel rotate by 0 "%" offset 2.5,0

set grid xtics mxtics ytics  back \
    linetype 3 linewidth 2 dashtype 2 lc rgb "#e0000000",\
    linetype 3 linewidth 2 dashtype 3 lc rgb "#e0000000"

unset label

plot   '' using 1:2 title "Linux"    with lines lw 5 lt rgb "web-green" ,\
       '' using 1:4 title "Unix"     with lines lw 5 lt rgb "light-blue" , \
       '' using 1:5 title "BSD"      with lines lw 5 lt rgb "#f7c500" ,\
       '' using 1:3 title "Windows"  with lines lw 5 lt rgb "#00adef" ,\
       '' using 1:7 title "Mac"      with lines lw 5 lt rgb "#6f0085" ,\
       '' using 1:6 title "NA/mixed" with lines lw 5 lt rgb "grey80"

#
# bottom plot
set size   1, 0.6
set origin 0, 0.0

# plot years
set format x "%g"
set bmargin 5
set tmargin 0

set yrange [0:10]
set ytics out  scale 0.2,0.2  0,2,9
set key below horizontal samplen 0.2 box lt rgb "grey"

replot

unset multiplot

set term pop
The above script also generates another diagram with detail view.

Verwendete Daten
# year  linux   windows unix    bsd     na_mixed        mac
1993.5	0	0	93.60 	4.60 	1.80 	0
1993.9	0	0	93.60 	4.80 	1.60 	0
1994.5	0	0	94.40 	4.20 	1.40 	0
1994.9	0	0	95.40 	4.60 	0	0
1995.5	0	0	96.20 	3.80 	0	0
1995.9	0	0	96.40 	3.60 	0	0
1996.5	0	0	97.40 	2.60 	0	0
1996.9	0	0	97.80 	2.20 	0	0
1997.5	0	0	98.80 	1.20 	0	0
1997.9	0	0	99.20 	0.80 	0	0
1998.5	0.20 	0	99.20 	0.60 	0	0
1998.9	0.20 	0	99.40 	0.20 	0.20 	0
1999.5	3.40 	0	96.40 	0	0.20 	0
1999.9	3.60 	0	94.20 	1.80 	0.40 	0
2000.5	5.60 	0	90.60 	3.40 	0.40 	0
2000.9	10.80 	0	85.40 	3.20 	0.60 	0
2001.5	8.80 	0	88.00 	2.60 	0.60 	0
2001.9	7.80 	0.20 	88.60 	2.40 	1.00 	0
2002.5	13.40 	0	82.80 	2.60 	1.20 	0
2002.9	14.60 	0	82.40 	2.40 	0.60 	0
2003.5	27.20 	0.20 	69.80 	2.40 	0.40 	0
2003.9	36.80 	0.20 	57.80 	2.20 	2.80 	0.20
2004.5	56.60 	0.20 	38.20 	1.80 	3.20 	0
2004.9	60.40 	0.20 	36.40 	2.00 	0.60 	0.40
2005.5	63.60 	0.20 	30.80 	1.40 	3.20 	0.80
2005.9	74.40 	0.20 	19.40 	0.80 	4.20 	1.00
2006.5	73.40 	0.40 	19.20 	0.80 	5.20 	1.00
2006.9	75.20 	0	17.20 	0.60 	6.40 	0.60
2007.5	77.80 	0.60 	11.80 	0.80 	8.40 	0.60
2007.9	84.60 	1.40 	6.00 	0.40 	7.20 	0.40
2008.5	85.40 	1.00 	5.00 	0.20 	8.00 	0.40
2008.9	87.80 	1.00 	4.60 	0.20 	6.20 	0.20
2009.5  88.60   1.00    4.40    0.20    5.80    0
2009.9  89.20   1.00    5.00    0.20    4.60    0
2010.5  91.00   1.00    4.40    0.20    3.40    0
2010.9  91.80   1.00    3.80    0.20    3.20    0
2011.5  91.4    0.8     4.6     0.2     3.0     0       # as retrieved 2011-12-02
2011.9  91.4    0.2     6.0     0.2     2.2     0       # as retrieved 2011-12-02
2012.5  92.4    0.4     4.8     0.4     2.2     0       # as retrieved 2012-10-27 http://i.top500.org/stats
2012.9  93.8    0.6     4.0     0.2     1.4     0       # as retrieved 2012-11-12 http://www.top500.org/statistics/list
2013.5  95.2    0.6     3.2     0.2     0.8     0       # as retrieved 2013-06-19 http://www.top500.org/statistics/list
2013.9  96.4    0.4     2.2     0.2     0.8     0       # as retrieved 2013-11-18 http://www.top500.org/statistics/list
2014.5  97.0    0.4     2.4     0.0     0.2     0       # as retrieved 2014-06-23 http://www.top500.org/statistics/list
2014.9  97.0    0.2     2.6     0.0     0.2     0       # as retrieved 2014-11-17 http://www.top500.org/statistics/list
2015.5  97.2    0.2     2.4     0.0     0.2     0       # as retrieved 2015-07-13 http://www.top500.org/statistics/list
2015.9  98.8    0.0     1.2     0.0     0.0     0       # as retrieved 2015-11-16 http://www.top500.org/statistics/list
2016.5  99.4    0       0.6     0       0       0       # as retrieved 2016-06-20 http://www.top500.org/statistics/list
2016.9  99.6    0       0.4     0       0       0       # as retrieved 2016-11-14 http://www.top500.org/statistics/list
2017.5  99.6    0       0.4     0       0       0       # as retrieved 2017-06-19 http://www.top500.org/statistics/list
2017.9  100     0       0       0       0       0       # as retrieved 2017-11-13 http://www.top500.org/statistics/list
2018.5  100     0       0       0       0       0       # as retrieved 2018-06-25 http://www.top500.org/statistics/list
2018.9  100     0       0       0       0       0       # as retrieved 2018-11-12 http://www.top500.org/statistics/list
2019.5  100     0       0       0       0       0       # as retrieved 2019-06-17 http://www.top500.org/statistics/list
2019.9  100     0       0       0       0       0       # as retrieved 2022-04-21 http://www.top500.org/statistics/list
2020.5  100     0       0       0       0       0       # as retrieved 2022-04-21 http://www.top500.org/statistics/list
2020.9  100     0       0       0       0       0       # as retrieved 2022-04-21 http://www.top500.org/statistics/list
2021.5  100     0       0       0       0       0       # as retrieved 2022-04-21 http://www.top500.org/statistics/list
2021.9  100     0       0       0       0       0       # as retrieved 2022-04-21 http://www.top500.org/statistics/list
היסטוריית הקובץ
ניתן ללחוץ על תאריך/שעה כדי לראות את הקובץ כפי שנראה באותו זמן.
| תאריך/שעה | תמונה ממוזערת | ממדים | משתמש | הערה | |
|---|---|---|---|---|---|
| נוכחית | 22:17, 21 באפריל 2022 | | 720 × 1,200 (47 ק"ב) | Benedikt.Seidl | update 2021 |
| 23:47, 17 ביוני 2019 |  | 720 × 1,200 (43 ק"ב) | HeWhoMowedTheLawn | Updated to June 2019 data | |
| 23:49, 13 בנובמבר 2018 |  | 720 × 1,200 (43 ק"ב) | HeWhoMowedTheLawn | updated to Nov 2018 data | |
| 14:24, 1 ביולי 2018 |  | 720 × 1,200 (42 ק"ב) | HeWhoMowedTheLawn | add in-diagram labels | |
| 13:13, 1 ביולי 2018 |  | 720 × 1,200 (42 ק"ב) | HeWhoMowedTheLawn | updated to June 2018 data | |
| 21:01, 13 בנובמבר 2017 |  | 720 × 1,200 (61 ק"ב) | HeWhoMowedTheLawn | Oops, world domination reached. What's next? | |
| 11:28, 22 ביוני 2017 |  | 720 × 1,200 (60 ק"ב) | HeWhoMowedTheLawn | updated to June 2017 data | |
| 01:31, 15 בנובמבר 2016 |  | 720 × 1,200 (60 ק"ב) | HeWhoMowedTheLawn | Updated to Nov 2016 data | |
| 22:10, 20 ביוני 2016 |  | 720 × 1,200 (59 ק"ב) | HeWhoMowedTheLawn | updated to June 2016 data | |
| 21:55, 17 בנובמבר 2015 |  | 720 × 1,200 (58 ק"ב) | HeWhoMowedTheLawn | updated to Nov 2015 data |
שימוש בקובץ
![]() אין בוויקיפדיה דפים המשתמשים בקובץ זה.
אין בוויקיפדיה דפים המשתמשים בקובץ זה.
שימוש גלובלי בקובץ
אתרי הוויקי השונים הבאים משתמשים בקובץ זה:
- שימוש באתר az.wikipedia.org
- שימוש באתר cs.wikipedia.org
- שימוש באתר de.wikipedia.org
- שימוש באתר de.wikibooks.org
- שימוש באתר en.wikipedia.org
- שימוש באתר et.wikipedia.org
- שימוש באתר eu.wikipedia.org
- שימוש באתר fi.wikipedia.org
- שימוש באתר it.wikipedia.org
- שימוש באתר ja.wikipedia.org
- שימוש באתר ko.wikipedia.org
- שימוש באתר ru.wikipedia.org
- שימוש באתר si.wikipedia.org
- שימוש באתר tr.wikipedia.org
- שימוש באתר uk.wikipedia.org
- שימוש באתר zh.wikipedia.org