
קובץ:Number of prokaryotic genomes and sequencing costs.svg

גודל התצוגה המקדימה הזאת מסוג PNG של קובץ ה־SVG הזה: 800 × 533 פיקסלים. רזולוציות אחרות: 320 × 213 פיקסלים | 640 × 427 פיקסלים | 1,024 × 683 פיקסלים | 1,280 × 853 פיקסלים | 2,560 × 1,707 פיקסלים | 1,350 × 900 פיקסלים.
לקובץ המקורי (קובץ SVG, הגודל המקורי: 1,350 × 900 פיקסלים, גודל הקובץ: 145 ק"ב)
| זהו קובץ שמקורו במיזם ויקישיתוף. תיאורו בדף תיאור הקובץ המקורי (בעברית) מוצג למטה. |
תקציר
| תיאור |
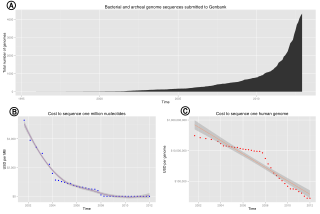
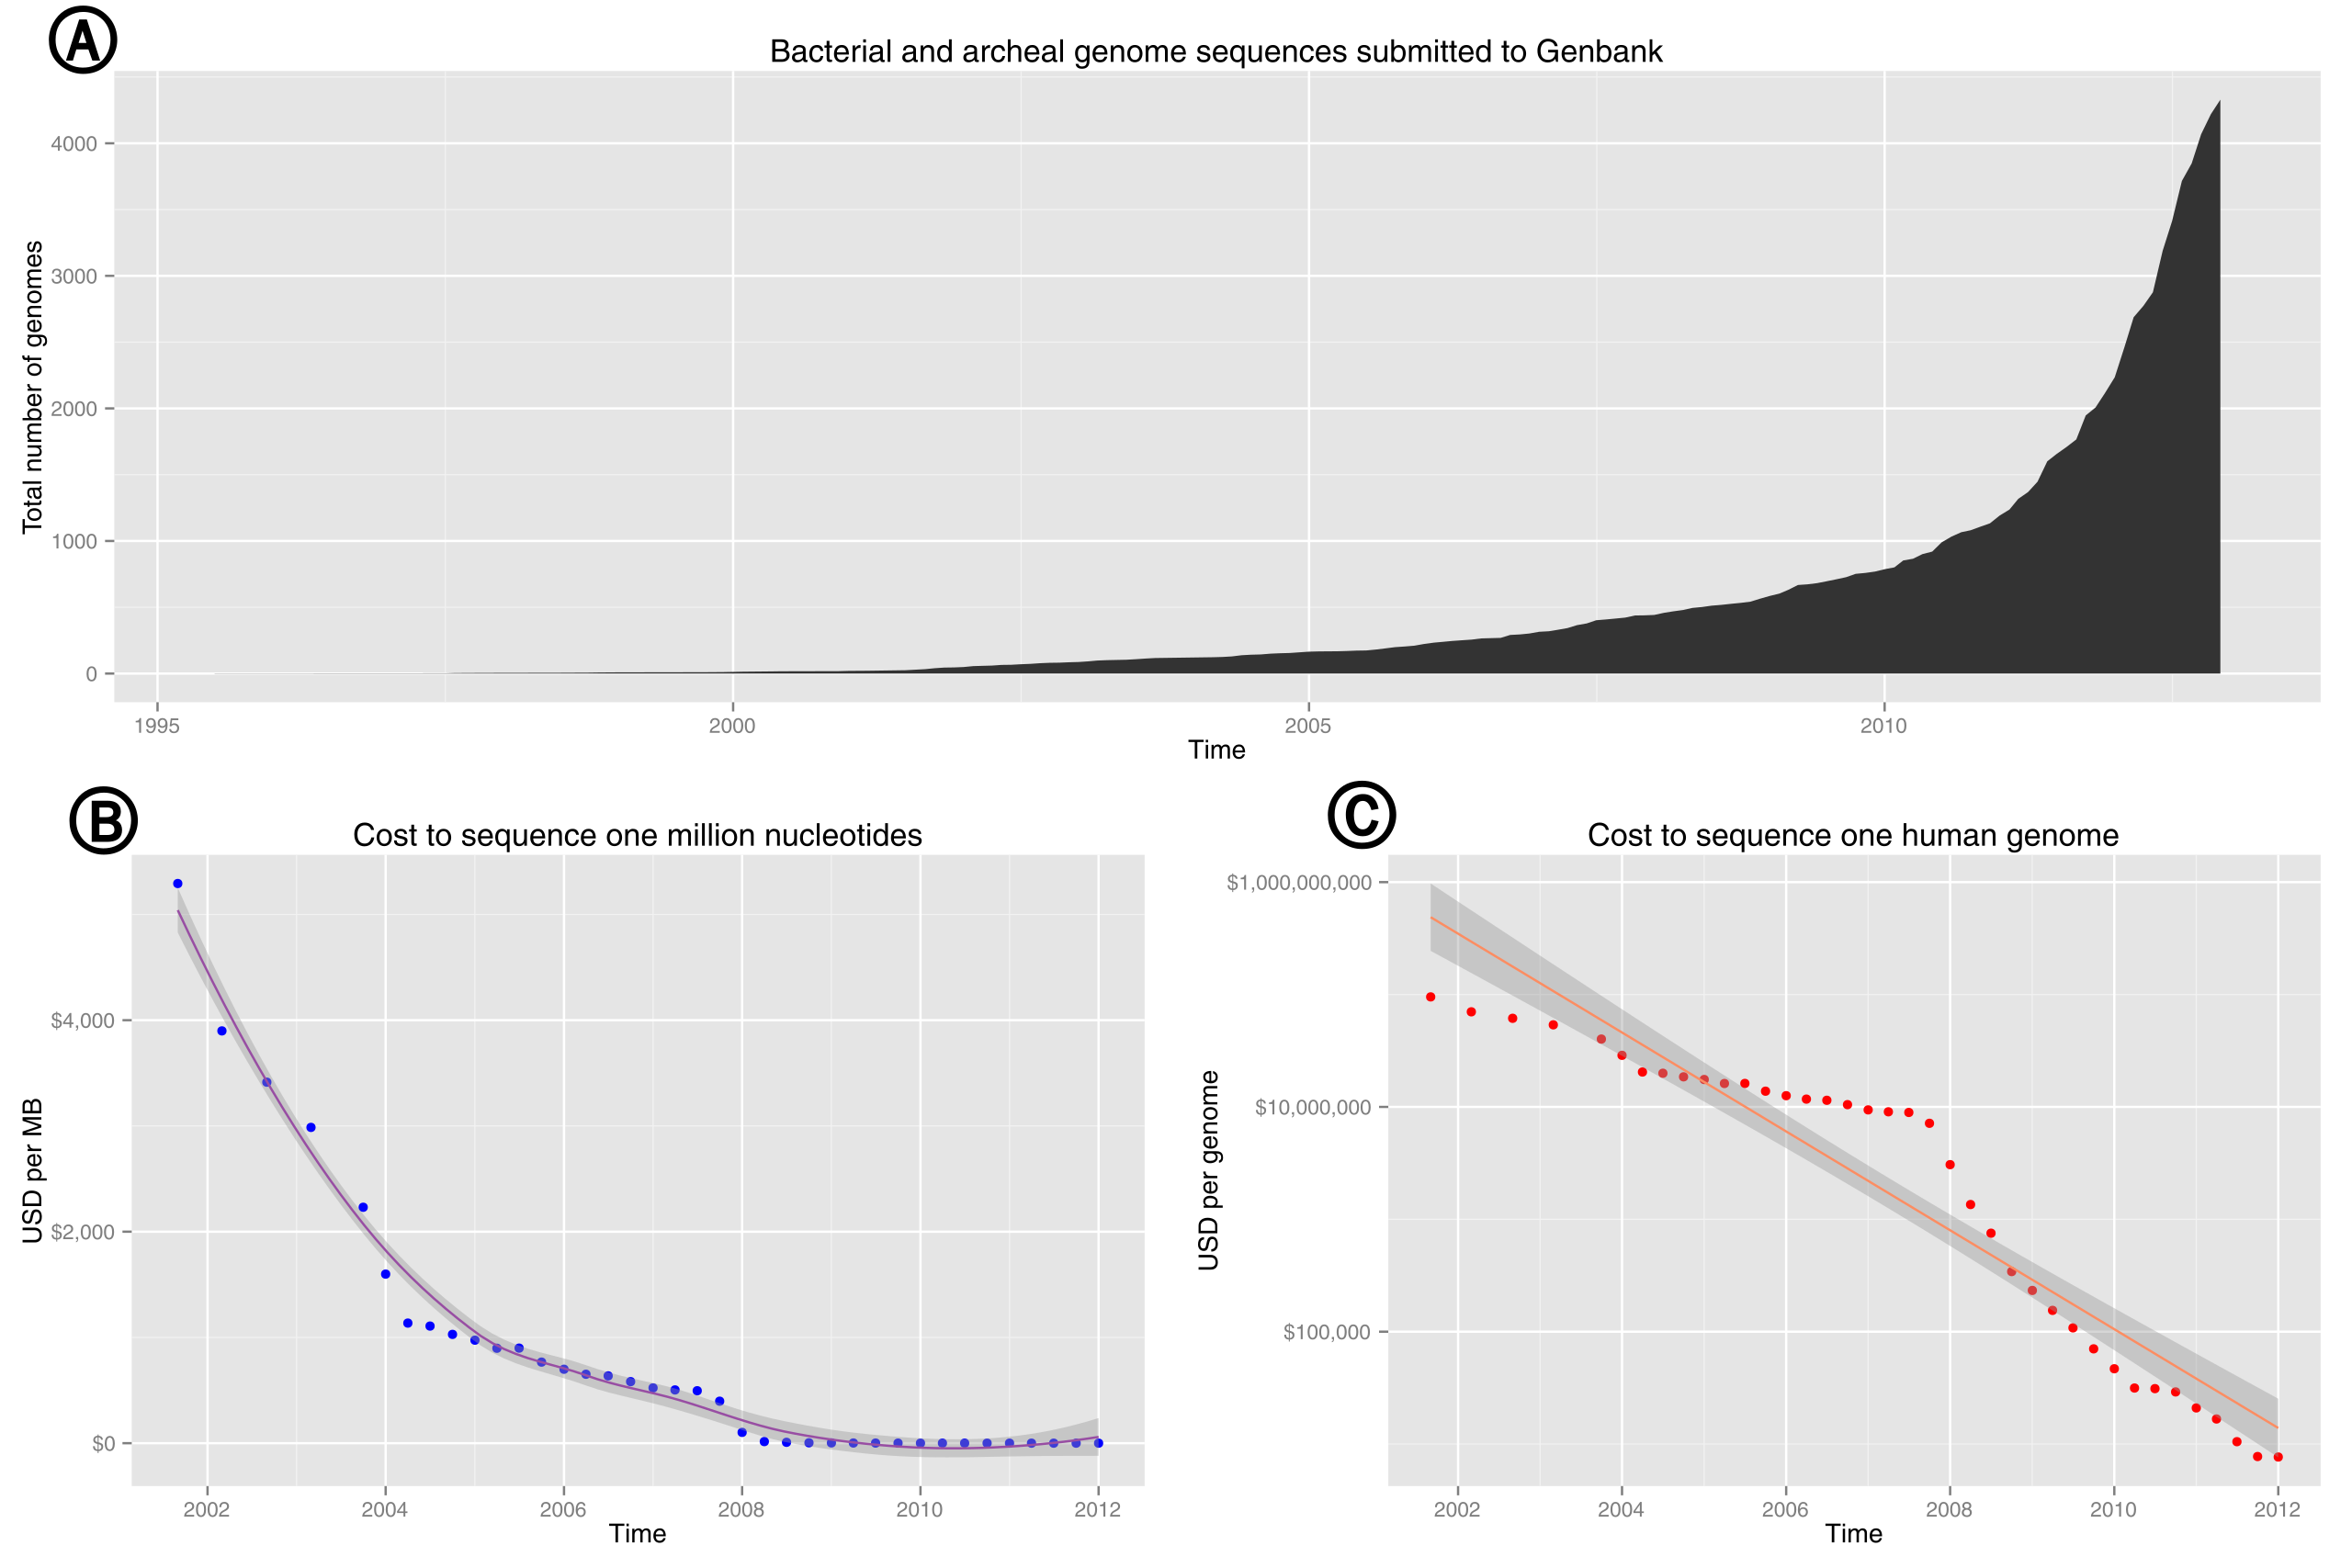
English: Plot of the total number of prokaryotic genomes submitted to Genbank as a function of time. Based on data from genome reports and genome.gov. Subfigures: (A) Exponential growth of genome sequence databases since 1995. (B) The cost in US Dollars (USD) to sequence one million bases. (C) The cost in USD to sequence a 3,000 Mb (human-sized) genome on a log10 transformed scale. |
| תאריך יצירה | |
| מקור | נוצר על־ידי מעלה היצירה |
| יוצר | Estevezj |
| גרסאות אחרות |
קובץ זה הוא יצירה נגזרת של : Bacterial and archeal genome sequences submitted to Genbank.svg: |
| SVGהתפתחות | R עם נוצרה ה גרפיקה וקטורית This file uses embedded text that can be easily translated using a text editor. |
| קוד מקור | R code# Download our tables from NCBI's FTP site. Accessed 14:30PST, 18 December 2012
prok <- read.table("ftp://ftp.ncbi.nlm.nih.gov/genomes/GENOME_REPORTS/prokaryotes.txt", sep="\t", comment.char="!", header=T)
# Pull release dates, while dropping rows lacking a release date.
prok <- as.Date(prok$Release.Date[prok$Release.Date != '-'],format="%Y/%m/%d")
# Bin our dates by month and year, tabulate, and save to a dataframe.
prok.cut <- as.data.frame(
table(
as.Date(
cut(prok, "month")
)
)
)
# Correct our column titles, calculate a running total, and reconvert from factor to date
colnames(prok.cut) <- c("Date", "Total")
prok.cut$Total <- cumsum(prok.cut$Total)
prok.cut$Date <- as.Date(prok.cut$Date)
# DNA Sequencing Costs from NHGRI: http://www.genome.gov/sequencingcosts/
# Data from http://www.genome.gov/pages/der/sequencing_cost.pptx
# After munging the pptx, download the tables from pastebin. Accessed 12:42PST, 2012-12-20
seq.cost <- read.table("http://pastebin.com/raw.php?i=NA6c4i70", header=TRUE)
# Format the date.
seq.cost$Date <- as.Date(seq.cost$Date,format="%m-%d-%Y")
# Draw our plots
library("ggplot2")
library("grid")
library("scales")
(p <- ggplot(prok.cut, aes(Date, Total)) + geom_area() + ggtitle("Bacterial and archeal genome sequences submitted to Genbank") + xlab('Time') + ylab("Total number of genomes")
)
(mb <- ggplot(seq.cost, aes(Date, USD.per.Mb)) + geom_point(colour = "blue") +
stat_smooth(color="#984EA3")+
ggtitle("Cost to sequence one million nucleotides") +
xlab('Time') +
ylab("USD per MB") +
scale_y_continuous(labels = dollar)
)
(genome <- ggplot(seq.cost, aes(Date, USD.per.Genome)) + geom_point(colour = "red") +
stat_smooth(method='lm',color="#FC8D62")+
ggtitle("Cost to sequence one human genome") +
xlab('Time') +
ylab("USD per genome") +
scale_y_log10(labels = dollar)
)
# This part is based on Hadley's Ggplot2 book (doi:10.1007/978-0-387-98141-3_8)
# Save our plot to SVG
library(grDevices)
svg(filename='ncbi-genomes.svg', width = 15, height = 10)
grid.newpage()
pushViewport(viewport(layout = grid.layout(2, 2)))
vplayout <- function(x, y)
viewport(layout.pos.row = x, layout.pos.col = y)
print(p, vp = vplayout(1, 1:2))
print(mb, vp = vplayout(2, 1))
print(genome, vp = vplayout(2, 2))
dev.off()
|
רישיון
אני, בעל זכויות היוצרים על היצירה הזאת, מפרסם אותה בזאת תחת הרישיונות הבאים:
הקובץ הזה מתפרסם לפי תנאי רישיון קריאייטיב קומונז ייחוס-שיתוף זהה 3.0 לא מותאם.
- הנכם רשאים:
- לשתף – להעתיק, להפיץ ולהעביר את העבודה
- לערבב בין עבודות – להתאים את העבודה
- תחת התנאים הבאים:
- ייחוס – יש לתת ייחוס הולם, לתת קישור לרישיון, ולציין אם נעשו שינויים. אפשר לעשות את זה בכל צורה סבירה, אבל לא בשום צורה שמשתמע ממנה שמעניק הרישיון תומך בך או בשימוש שלך.
- שיתוף זהה – אם תיצרו רמיקס, תשנו, או תבנו על החומר, חובה עליכם להפיץ את התרומות שלך לפי תנאי רישיון זהה או תואם למקור.

|
מוענקת בכך הרשות להעתיק, להפיץ או לשנות את המסמך הזה, לפי תנאי הרישיון לשימוש חופשי במסמכים של גנו, גרסה 1.2 או כל גרסה מאוחרת יותר שתפורסם על־ידי המוסד לתוכנה חופשית; ללא פרקים קבועים, ללא טקסט עטיפה קדמית וללא טקסט עטיפה אחורית. עותק של הרישיון כלול בפרק שכותרתו הרישיון לשימוש חופשי במסמכים של גנו. |
הנכם מוזמנים לבחור את הרישיון הרצוי בעיניכם.
היסטוריית הקובץ
ניתן ללחוץ על תאריך/שעה כדי לראות את הקובץ כפי שנראה באותו זמן.
| תאריך/שעה | תמונה ממוזערת | ממדים | משתמש | הערה | |
|---|---|---|---|---|---|
| נוכחית | 08:04, 21 בדצמבר 2012 | | 900 × 1,350 (145 ק"ב) | Estevezj | Added subplot labels. |
| 07:50, 21 בדצמבר 2012 |  | 900 × 1,350 (107 ק"ב) | Estevezj | {{Information |Description ={{en|1=Plot of the total number of prokaryotic genomes submitted to Genbank as a function of time. Based on data from [http://www.ncbi.nlm.nih.gov/genome genome reports] and [http://www.genome.gov/sequencingcosts/ genome.... |
שימוש בקובץ
![]() אין בוויקיפדיה דפים המשתמשים בקובץ זה.
אין בוויקיפדיה דפים המשתמשים בקובץ זה.
שימוש גלובלי בקובץ
אתרי הוויקי השונים הבאים משתמשים בקובץ זה:
- שימוש באתר bs.wikipedia.org
- שימוש באתר en.wikipedia.org
- שימוש באתר id.wikipedia.org
- שימוש באתר mk.wikipedia.org
- שימוש באתר sr.wikipedia.org