לדלג לתוכן

קובץ:Michelsonmorley-boxplot.svg

תוכן הדף אינו נתמך בשפות אחרות.
מתוך ויקיפדיה, האנציקלופדיה החופשית

לקובץ המקורי (קובץ SVG, הגודל המקורי: 432 × 432 פיקסלים, גודל הקובץ: 12 ק"ב)

הצגת תמונה זו בשפה .
ויקישיתוף זהו קובץ שמקורו במיזם ויקישיתוף. תיאורו בדף תיאור הקובץ המקורי (בעברית) מוצג למטה.

תקציר

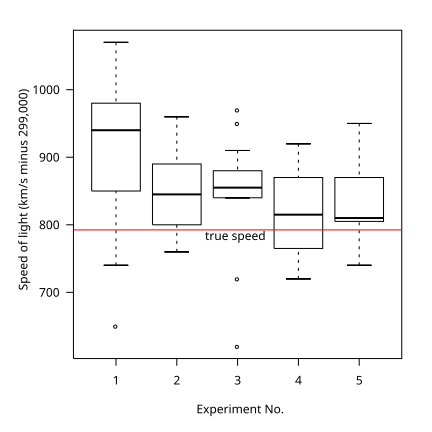
תיאור Boxplot representing Michelson's data on the speed of light. It consists of five experiments, each made of 20 consecutive runs.
תאריך יצירה
מקור נוצר על־ידי מעלה היצירה
יוצר User:Schutz
SVGהתפתחות 
InfoField
 
.קוד המקור של קובץ SVG זה הוא תקין
 
R עם‎‎ נוצרה ה גרפיקה וקטורית

This data is not from the Michelson-Morley experiment but from Michelson's measurement of the speed of light. See MICHELSON, A. A. (1882). Experimental determination of the velocity of light made at the United States Naval Academy, Annapolis. Astronomic Papers 1 pp. 109-145 U.S. Nautical Almanac Office, or S. M. Stigler (1977) Do robust estimators work with real data? Annals of Statistics 5, 1055–1098.

Original upload by User:Schutz

Boxplot representing Michelson's data on the speed of light. It consists of five experiments, each made of 20 consecutive runs. Note that the oblique line is incorrect, and probably due to a bug in the Mediawiki software/SVG converter. The graphic was created by User:Schutz for Wikipedia on 28 December 2006, using the R statistical project. The program that generated the graphic is given below; the data and the idea are from the R help page for the morley dataset (see help(morley)). The graph was exported in postscript format, converted to SVG using the pstoedit command, and the layout was slightly modified using Inkscape before upload.

 
  data(morley)
  morley$Expt <- factor(morley$Expt)
  morley$Run <- factor(morley$Run)
  attach(morley)

  postscript("Michelsonmorley-boxplot.ps", paper="special", height=6, width=6,
             horizontal=F)
  par(las=1)
  par(mar=c(5.1, 5.1, 2.1, 2.1))
  par(font=2)
  par(font.axis=2)
  boxplot(Speed ~ Expt, xlab = "Experiment No.", ylab="Speed of light (km/s minus 299,000)")
  abline(h=792.458, lty=3)
  dev.off()
  

New upload by User:Mwtoews

Boxplot representing Michelson's data on the speed of light. It consists of five experiments, each made of 20 consecutive runs.

The graphic was originally created by User:Schutz for Wikipedia on 28 December 2006, using the R statistical project. The program that generated the graphic is given below; the data and the idea are from the R help page for the morley dataset (see help(morley)). The graph was exported in PDF format, converted to SVG using Adobe Illustrator, and the layout was slightly modified using Vim before upload.

data(morley)
morley$Expt <- factor(morley$Expt)

pdf("Michelsonmorley-boxplot.pdf", height=6, width=6)
par(las=1, mar=c(5.1, 5.1, 2.1, 2.1))
boxplot(Speed ~ Expt, morley, xlab = "Experiment No.",
        ylab="Speed of light (km/s minus 299,000)")
abline(h=792.458, col="red")
text(3,792.458,"true\nspeed")
dev.off()

רישיון

Public domain ברצוני, בעלי זכויות היוצרים על יצירה זו, לשחרר יצירה זו לנחלת הכלל. זה תקף בכל העולם.
יש מדינות שבהן הדבר אינו אפשרי על פי חוק, אם כך:
אני מעניק לכל אחד את הזכות להשתמש בעבודה זו לכל מטרה שהיא, ללא תנאים כלשהם, אלא אם כן תנאים כאלה נדרשים על פי חוק.

The creator and uploader also believes that this graphic is a trivial work which does not qualify for copyright.

Reference

  • A. J. Weekes (1986) A Genstat Primer. London: Edward Arnold.

כיתובים

נא להוסיף משפט שמסביר מה הקובץ מייצג

פריטים שמוצגים בקובץ הזה

מוצג

image/svg+xml

היסטוריית הקובץ

ניתן ללחוץ על תאריך/שעה כדי לראות את הקובץ כפי שנראה באותו זמן.

תאריך/שעהתמונה ממוזערתממדיםמשתמשהערה
נוכחית08:14, 16 בספטמבר 2024תמונה ממוזערת לגרסה מ־08:14, 16 בספטמבר 2024‪432 × 432‬ (12 ק"ב)Jeffrey KimFile uploaded using svgtranslate tool (https://svgtranslate.toolforge.org/). Added translation for yue.
12:25, 3 במאי 2008תמונה ממוזערת לגרסה מ־12:25, 3 במאי 2008‪432 × 432‬ (11 ק"ב)Papa Novemberrm opaque bg. No copyright claimed for non-creative derivative work.
23:30, 30 באוקטובר 2007תמונה ממוזערת לגרסה מ־23:30, 30 באוקטובר 2007‪432 × 432‬ (11 ק"ב)Mwtoews
23:27, 30 באוקטובר 2007תמונה ממוזערת לגרסה מ־23:27, 30 באוקטובר 2007‪432 × 432‬ (11 ק"ב)Mwtoews
23:24, 30 באוקטובר 2007תמונה ממוזערת לגרסה מ־23:24, 30 באוקטובר 2007‪432 × 432‬ (12 ק"ב)Mwtoews
20:43, 28 בדצמבר 2006תמונה ממוזערת לגרסה מ־20:43, 28 בדצמבר 2006‪720 × 720‬ (19 ק"ב)Schutz

הדף הבא משתמש בקובץ הזה:

שימוש גלובלי בקובץ

מטא־נתונים