
קובץ:Landkreis Muenchen Bevoelkerungsentwicklung.svg

גודל התצוגה המקדימה הזאת מסוג PNG של קובץ ה־SVG הזה: 800 × 400 פיקסלים. רזולוציות אחרות: 320 × 160 פיקסלים | 640 × 320 פיקסלים | 1,024 × 512 פיקסלים | 1,280 × 640 פיקסלים | 2,560 × 1,280 פיקסלים.
לקובץ המקורי (קובץ SVG, הגודל המקורי: 800 × 400 פיקסלים, גודל הקובץ: 33 ק"ב)
| זהו קובץ שמקורו במיזם ויקישיתוף. תיאורו בדף תיאור הקובץ המקורי (בעברית) מוצג למטה. |
תקציר
| תיאור |
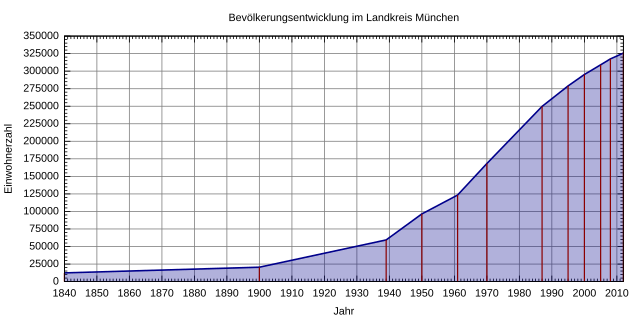
Deutsch: Bevölkerungsentwicklung im Landkreis München seit 1840. Datenquelle: [1] English: Population development in Landkreis Munich since 1840. Data source: [2] |
| תאריך יצירה | |
| מקור | נוצר על־ידי מעלה היצירה |
| יוצר | Michael Fiedler |
רישיון
אני, בעל זכויות היוצרים על עבודה זו, מפרסם בזאת את העבודה תחת הרישיון הבא:
הקובץ הזה מתפרסם לפי תנאי רישיון קריאייטיב קומונז ייחוס-שיתוף זהה 3.0 לא מותאם.
- הנכם רשאים:
- לשתף – להעתיק, להפיץ ולהעביר את העבודה
- לערבב בין עבודות – להתאים את העבודה
- תחת התנאים הבאים:
- ייחוס – יש לתת ייחוס הולם, לתת קישור לרישיון, ולציין אם נעשו שינויים. אפשר לעשות את זה בכל צורה סבירה, אבל לא בשום צורה שמשתמע ממנה שמעניק הרישיון תומך בך או בשימוש שלך.
- שיתוף זהה – אם תיצרו רמיקס, תשנו, או תבנו על החומר, חובה עליכם להפיץ את התרומות שלך לפי תנאי רישיון זהה או תואם למקור.
Gnuplot script to generate this plot
. Gnuplot עם נוצרה ה תמונה
#!/usr/bin/gnuplot
# gnuplot 4.6 / Debian 7
#
# Erstellt von Michael Fiedler <michael.fiedler87@gmx.de>
# Lizenz: CC-BY-SA 3.0 unported, https://creativecommons.org/licenses/by-sa/3.0/deed.de
# Basierend auf http://commons.wikimedia.org/wiki/File:Muc_population.svg von Gorgo

set title 'Bevölkerungsentwicklung im Landkreis München'
unset key
set style fill transparent solid 0.3
set grid

set xlabel 'Jahr'
set xrange [1840:2012]
# Jahreszahl alle 10 Jahre
set xtics 10
# nochmal unterteilen
set mxtics 10

set ylabel 'Einwohnerzahl'
# Beschriftungsintervall
set ytics 25000
# weitere Unterteilung ohne Beschriftung
set mytics 5
set yrange ['0':'350000']


set terminal svg size 800,400 font 'Arial,10'
set output 'Landkreis_Muenchen_Bevoelkerungsentwicklung.svg'

# '-' nimmt die nachfolgenden Daten als Eingabewerte
plot '-' using 1:2 with filledcurves below x1 linetype rgb 'dark-blue' linewidth 2, \
	    '-' using 1:2 with impulses linecolor rgbcolor 'dark-red' linewidth 1.5
# Datenquelle: http://de.wikipedia.org/wiki/Landkreis_München
	1840 12393
	1900 20521
	1939 59377
	1950 96475
	1961 123369
	1970 168336
	1987 249784
	1995 279007
	2000 295247
	2005 309080
	2008 317543
	2012 325744
EOF
	1840 12393
	1900 20521
	1939 59377
	1950 96475
	1961 123369
	1970 168336
	1987 249784
	1995 279007
	2000 295247
	2005 309080
	2008 317543
	2012 325744
EOF
היסטוריית הקובץ
ניתן ללחוץ על תאריך/שעה כדי לראות את הקובץ כפי שנראה באותו זמן.
| תאריך/שעה | תמונה ממוזערת | ממדים | משתמש | הערה | |
|---|---|---|---|---|---|
| נוכחית | 21:31, 23 במרץ 2014 | | 400 × 800 (33 ק"ב) | Simified | User created page with UploadWizard |
שימוש בקובץ
![]() אין בוויקיפדיה דפים המשתמשים בקובץ זה.
אין בוויקיפדיה דפים המשתמשים בקובץ זה.
שימוש גלובלי בקובץ
אתרי הוויקי השונים הבאים משתמשים בקובץ זה:
- שימוש באתר de.wikipedia.org