
קובץ:Landkreis Forchheim Bevoelkerungsentwicklung.svg

גודל התצוגה המקדימה הזאת מסוג PNG של קובץ ה־SVG הזה: 800 × 400 פיקסלים. רזולוציות אחרות: 320 × 160 פיקסלים | 640 × 320 פיקסלים | 1,024 × 512 פיקסלים | 1,280 × 640 פיקסלים | 2,560 × 1,280 פיקסלים.
לקובץ המקורי (קובץ SVG, הגודל המקורי: 800 × 400 פיקסלים, גודל הקובץ: 30 ק"ב)
| זהו קובץ שמקורו במיזם ויקישיתוף. תיאורו בדף תיאור הקובץ המקורי (בעברית) מוצג למטה. |
תקציר
| תיאור |
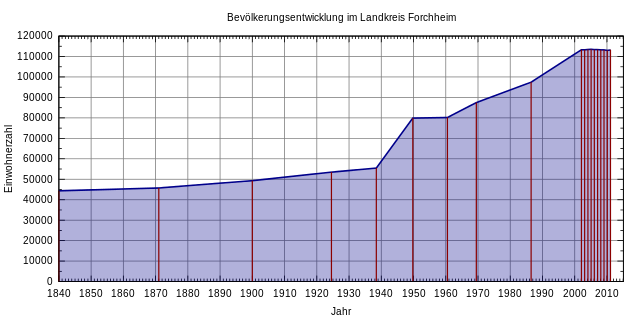
Deutsch: Bevölkerungsentwicklung des Landkreises Forchheim. Graphik nach "Bayerisches Landesamt fuer Statistik: Statistik kommunal 2012 ‒ Eine Auswahl wichtiger statistischer Daten fuer den Landkreis Forchheim.". English: Population development of Landkreis Forchheim 1840‒2011 |
| תאריך יצירה | |
| מקור | נוצר על־ידי מעלה היצירה |
| יוצר | Michael Fiedler |
רישיון
אני, בעל זכויות היוצרים על עבודה זו, מפרסם בזאת את העבודה תחת הרישיון הבא:
הקובץ הזה מתפרסם לפי תנאי רישיון קריאייטיב קומונז ייחוס-שיתוף זהה 3.0 לא מותאם.
- הנכם רשאים:
- לשתף – להעתיק, להפיץ ולהעביר את העבודה
- לערבב בין עבודות – להתאים את העבודה
- תחת התנאים הבאים:
- ייחוס – יש לתת ייחוס הולם, לתת קישור לרישיון, ולציין אם נעשו שינויים. אפשר לעשות את זה בכל צורה סבירה, אבל לא בשום צורה שמשתמע ממנה שמעניק הרישיון תומך בך או בשימוש שלך.
- שיתוף זהה – אם תיצרו רמיקס, תשנו, או תבנו על החומר, חובה עליכם להפיץ את התרומות שלך לפי תנאי רישיון זהה או תואם למקור.
Gnuplot script to generate this plot
. Gnuplot עם נוצרה ה תמונה
#!/usr/bin/gnuplot
# gnuplot 4.6 / Debian 7
#
# Graphik nach "Bayerisches Landesamt fuer Statistik: Statistik kommunal 2012 -
# Eine Auswahl wichtiger statistischer Daten fuer den Landkreis Forchheim.",
# https://www.statistik.bayern.de/statistikkommunal/09474.pdf
#
# Erstellt von Michael Fiedler <michael.fiedler87@gmx.de>
# Lizenz: CC-BY-SA 3.0 unported, https://creativecommons.org/licenses/by-sa/3.0/deed.de
# Basierend auf http://commons.wikimedia.org/wiki/File:Muc_population.svg von Gorgo

# input
set timefmt "%d.%m.%Y"
set datafile separator ";"

# output
set title 'Bevölkerungsentwicklung im Landkreis Forchheim'
unset key
set style fill transparent solid 0.3
set grid

set xdata time
set xlabel 'Jahr'
set xrange ['01.12.1840':'31.12.2015']
# Jahreszahl alle 10 Jahre (Beginn,Erhoehung in 0.1 Sekunden,Ende)
# Der Zahlenwert entspricht einem Jahr mit 365,25 Tagen
set xtics '01.12.1840',315576000,'31.12.2015'
# Zehnjahresintervall in 9 Intervalle unterteilt (jedes Jahr eine Markierung)
set mxtics 10
set format x '%Y'

set ylabel 'Einwohnerzahl'
# Beschriftungsintervall
set ytics 10000
# weitere Unterteilung ohne Beschriftung
set mytics 2
set yrange ['0':'120000']
set format y '%.0f'


set terminal svg size 800,400 font 'Arial,10'
set output 'Landkreis_Forchheim_Bevoelkerungsentwicklung.svg'

# '-' nimmt die nachfolgenden Daten als Eingabewerte
plot '-' using 1:($2) with filledcurves below x1 linetype rgb 'dark-blue' linewidth 2, \
	    '-' using 1:($2) with impulses linecolor rgbcolor 'dark-red' linewidth 1.5
	01.12.1840;44369
	01.12.1871;45745
	01.12.1900;49317
	16.06.1925;53499
	17.05.1939;55474
	13.09.1950;79923
	06.06.1961;80188
	27.05.1970;87454
	25.05.1987;97433
	31.12.2002;113331
	31.12.2003;113258
	31.12.2004;113447
	31.12.2005;113543
	31.12.2006;113397
	31.12.2007;113389
	31.12.2008;113289
	31.12.2009;113236
	31.12.2010;112985
	31.12.2011;113207
EOF
היסטוריית הקובץ
ניתן ללחוץ על תאריך/שעה כדי לראות את הקובץ כפי שנראה באותו זמן.
| תאריך/שעה | תמונה ממוזערת | ממדים | משתמש | הערה | |
|---|---|---|---|---|---|
| נוכחית | 12:40, 23 במרץ 2014 | | 400 × 800 (30 ק"ב) | Simified | fix mxtics |
| 09:12, 23 במרץ 2014 |  | 400 × 800 (29 ק"ב) | Simified | User created page with UploadWizard |
שימוש בקובץ
![]() אין בוויקיפדיה דפים המשתמשים בקובץ זה.
אין בוויקיפדיה דפים המשתמשים בקובץ זה.