
קובץ:Iranian University Entrance Exam - Applicants and Admissions - 1379 1392 SH.svg

גודל התצוגה המקדימה הזאת מסוג PNG של קובץ ה־SVG הזה: 720 × 540 פיקסלים. רזולוציות אחרות: 320 × 240 פיקסלים | 640 × 480 פיקסלים | 1,024 × 768 פיקסלים | 1,280 × 960 פיקסלים | 2,560 × 1,920 פיקסלים.
לקובץ המקורי (קובץ SVG, הגודל המקורי: 720 × 540 פיקסלים, גודל הקובץ: 58 ק"ב)
| זהו קובץ שמקורו במיזם ויקישיתוף. תיאורו בדף תיאור הקובץ המקורי (בעברית) מוצג למטה. |
תקציר
| תיאור |
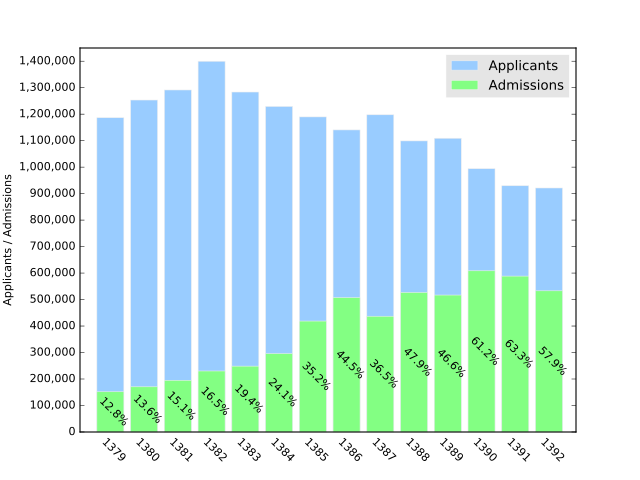
فارسی: تعداد داوطلبان و پذیرفتهشدگان کنکور سراسری ایران بین سالهای 1379 تا 1392 |
| תאריך יצירה | |
| מקור | נוצר על־ידי מעלה היצירה |
| יוצר | دالبا |
#!/usr/bin/env python
# -*- coding: UTF-8 -*-

import os

import numpy as np
import matplotlib.pyplot as plt

# from http://www.farsnews.com/newstext.php?nn=13930201000641
rawdata = """
1379		1186649		151943		80/12
1380		1253529		170702		62/13
1381		1291471		195281		12/15
1382		1399943		230339		72/17
1383		1283737		248646		37/19
1384		1229301		295866		87/23
1385		1189787		418855		30/35
1386		1140648		507194		47/44
1387		1197771		437069		49/36
1388		1099145		526803		93/47
1389		1109190		517068		62/46
1390		994181		608732		23/61
1391		929801		588610		30/63
1392		921386		533115		67/56
"""

splitted_data = rawdata.split()
years = np.array([int(y) for y in splitted_data[::4]])
applicants = [int(a) for a in splitted_data[1::4]]
admissions = [int(a) for a in splitted_data[2::4]]

fig = plt.figure()
ax = fig.add_subplot(111)

plt.style.use('ggplot')

axistexts = ax.set_xticklabels([str(y) for y in years])

plt.setp(axistexts, rotation=-45, fontsize=10, clip_on=False)
plt.tick_params(
    axis='x',          # changes apply to the x-axis
    which='both',      # both major and minor ticks are affected
    bottom='off',      # ticks along the bottom edge are off
    top='off',         # ticks along the top edge are off
    labelbottom='on',  # labels along the bottom edge are off
)

plt.xlim(years[0] - .5, years[-1] + 1.2)
plt.xticks(years + .5, years)
max_applicants = max(applicants)
plt.ylim(0, max_applicants + 50000)
plt.yticks(
    range(0, max_applicants + 100000, 100000),
    list(format(i, ',') for i in range(0, max_applicants + 100000, 100000)),
)
plt.ylabel('Applicants / Admissions')

plt.bar(years, applicants, facecolor='#99CCFF')
plt.bar(years, admissions, facecolor='#83FF83')

ax.legend(['Applicants', 'Admissions'])
for y, ap, ad in zip(years ,applicants, admissions):
    plt.text(
        y + .5,
        ad/2,
        format(ad/ap, '.1%'),
        ha='center',
        va= 'center',
        rotation='-45',
    )

plt.savefig(
    os.path.basename(__file__).replace('.py', '.svg')
)
plt.show()
רישיון
אני, בעל זכויות היוצרים על עבודה זו, מפרסם בזאת את העבודה תחת הרישיון הבא:
הקובץ הזה מתפרסם לפי תנאי רישיון קריאייטיב קומונז ייחוס-שיתוף זהה 4.0 בין־לאומי.
- הנכם רשאים:
- לשתף – להעתיק, להפיץ ולהעביר את העבודה
- לערבב בין עבודות – להתאים את העבודה
- תחת התנאים הבאים:
- ייחוס – יש לתת ייחוס הולם, לתת קישור לרישיון, ולציין אם נעשו שינויים. אפשר לעשות את זה בכל צורה סבירה, אבל לא בשום צורה שמשתמע ממנה שמעניק הרישיון תומך בך או בשימוש שלך.
- שיתוף זהה – אם תיצרו רמיקס, תשנו, או תבנו על החומר, חובה עליכם להפיץ את התרומות שלך לפי תנאי רישיון זהה או תואם למקור.
היסטוריית הקובץ
ניתן ללחוץ על תאריך/שעה כדי לראות את הקובץ כפי שנראה באותו זמן.
| תאריך/שעה | תמונה ממוזערת | ממדים | משתמש | הערה | |
|---|---|---|---|---|---|
| נוכחית | 17:33, 5 במרץ 2016 | | 540 × 720 (58 ק"ב) | Dalba | Removed the percentage from the applicants bar as it was more confusing than informative. |
| 08:01, 11 בדצמבר 2014 |  | 540 × 720 (61 ק"ב) | Dalba | Without title | |
| 07:44, 11 בדצמבר 2014 |  | 540 × 720 (74 ק"ב) | Dalba | User created page with UploadWizard |
שימוש בקובץ
![]() אין בוויקיפדיה דפים המשתמשים בקובץ זה.
אין בוויקיפדיה דפים המשתמשים בקובץ זה.
שימוש גלובלי בקובץ
אתרי הוויקי השונים הבאים משתמשים בקובץ זה:
- שימוש באתר en.wikipedia.org
- שימוש באתר fa.wikipedia.org