
קובץ:Instrumental Temperature Record by R Rhode.svg

גודל התצוגה המקדימה הזאת מסוג PNG של קובץ ה־SVG הזה: 800 × 590 פיקסלים. רזולוציות אחרות: 320 × 236 פיקסלים | 640 × 472 פיקסלים | 1,024 × 756 פיקסלים | 1,280 × 944 פיקסלים | 2,560 × 1,889 פיקסלים | 801 × 591 פיקסלים.
לקובץ המקורי (קובץ SVG, הגודל המקורי: 801 × 591 פיקסלים, גודל הקובץ: 126 ק"ב)
| זהו קובץ שמקורו במיזם ויקישיתוף. תיאורו בדף תיאור הקובץ המקורי (בעברית) מוצג למטה. |
תקציר
| תיאור |
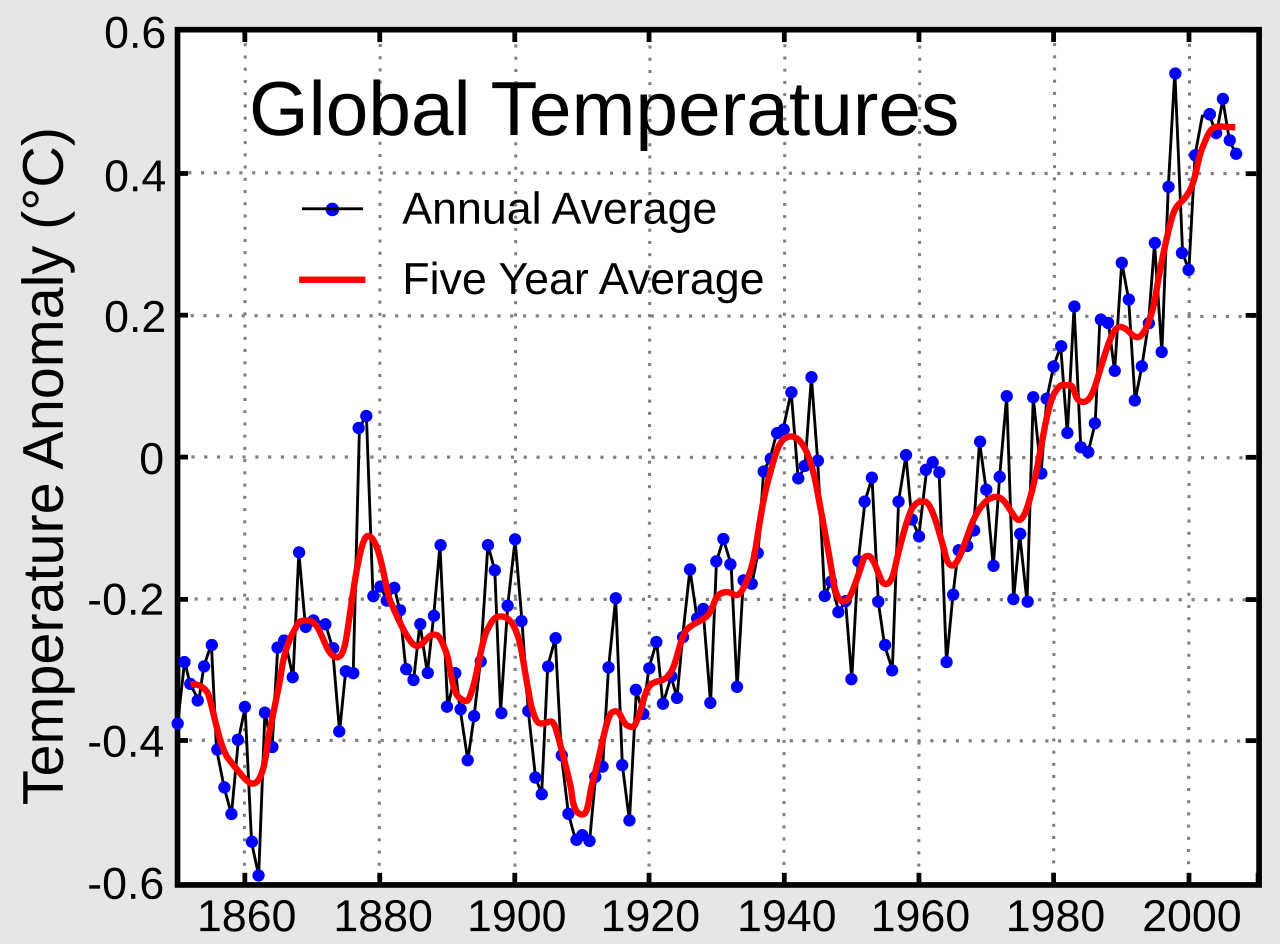
English: This image shows the instrumental record of global average temperatures as compiled by the Climatic Research Unit of the University of East Anglia and the Hadley Centre of the UK Meteorological Office. Data set HadCRUT3 was used. HadCRUT3 is a record of surface temperatures collected from land and ocean-based stations. The most recent documentation for this data set is Following the common practice of the IPCC, the zero on this figure is the mean temperature from 1961-1990.
This figure is an SVG copy of an original prepared by Robert A. Rohde from publicly available data. The original figure is part of the Global Warming Art project. |
| תאריך יצירה | 25 ביוני 2008 (תאריך העלאה מקורי) |
| מקור | הועבר מ- en.wikipedia לוויקישיתוףעל ידי IngerAlHaosului באמצעות CommonsHelper. |
| יוצר |
מעלה היצירה המקורי היה Leland McInnes מוויקיפדיה האנגלית |
| SVGהתפתחות | Matplotlib עם נוצרה ה גרפיקה וקטורית |
| קוד מקור | Python code#!/usr/bin/env python
# -*- coding: utf-8 -*-
import matplotlib.pylab as plt
import urllib
import matplotlib
# Download latest data directly from NASA, and process
temp_file = urllib.urlopen("http://data.giss.nasa.gov/gistemp/graphs/Fig.A2.txt")
data_rows = [x.split() for x in temp_file if x.startswith(" 1") or x.startswith(" 2")]
years = [int(x[0]) for x in data_rows if x[1] != "*"]
temps = [float(x[1]) for x in data_rows if x[1] != "*"]
moving_av_temps = [float(x[2]) for x in data_rows if x[2] != "*"]
moving_av_years = [int(x[0]) for x in data_rows if x[2] != "*"]
# Set some parameters to ensure suitable output
matplotlib.rcParams['backend'] = "Cairo"
matplotlib.rcParams['font.sans-serif'] = ["Arial"]
matplotlib.rcParams['xtick.labelsize'] = 20
matplotlib.rcParams['ytick.labelsize'] = 20
matplotlib.rcParams['svg.embed_char_paths'] = True
ax = plt.axes([0.125,0.05,0.835,0.92])
plt.grid(color="#cccccc", linestyle=":", lw=2, zorder=1)
plt.plot(years, temps, "k-", lw=1.2, marker="o", markerfacecolor="blue", zorder=3, solid_joinstyle="round", label="Annual average")
plt.plot(moving_av_years, moving_av_temps, "r-", lw=3.5, zorder=4, label="Five Year Average")
plt.ylabel(u"Temperature anomaly (°C)", size=24)
plt.text(1884,0.55,"Global Temperatures",ha="left", va="center",size=38)
plt.legend(loc=(0.04,0.68), prop=matplotlib.font_manager.FontProperties(size=24))
plt.xlim(1880,2015)
plt.ylim(-0.45,0.65)
plt.savefig("instrumental-temperature-record.svg", facecolor="#e0e0e0")
plt.show()
|
רישיון
Image from Global Warming Art
This image is an original work created for Global Warming Art. Please refer to the image description page for more information.

|
מוענקת בכך הרשות להעתיק, להפיץ או לשנות את המסמך הזה, לפי תנאי הרישיון לשימוש חופשי במסמכים של גנו, גרסה 1.2 או כל גרסה מאוחרת יותר שתפורסם על־ידי המוסד לתוכנה חופשית; ללא פרקים קבועים, ללא טקסט עטיפה קדמית וללא טקסט עטיפה אחורית. עותק של הרישיון כלול בפרק שכותרתו הרישיון לשימוש חופשי במסמכים של גנו. |
| הקובץ הזה מתפרסם לפי תנאי רישיון קריאייטיב קומונז ייחוס-שיתוף זהה 3.0 לא מותאם. | ||
| ||
| תבנית רישוי זו הוספה לקובץ כחלק מעדכון רישיון GFDL. |
| Dragons flight's Temperature Record Series |
| This figure is part of a series of plots created by Dragons flight to illustrate changes in Earth's temperature and climate across many different time scales. |
| Time Period: 25 yrs | 150 yrs | 1 kyr | 2 kyr | 12 kyr | 450 kyr | 5 Myr | 65 Myr | 500 Myr |
| For articles related to this topic see: Temperature record |
יומן העלאה מקורי
תיאור הקובץ המקורי נמצא כאן. כל שמות המשתמשים הבאים מתייחסים ל-en.wikipedia.
- 2008-06-25 01:36 Leland McInnes 801×591× (129310 bytes)
- 2008-06-25 00:13 Leland McInnes 801×593× (129750 bytes)
- 2008-06-24 23:38 Leland McInnes 801×593× (129747 bytes) This image shows the instrumental record of global average temperatures as compiled by the [[Climatic Research Unit]] of the [[University of East Anglia]] and the [[Hadley Centre]] of the [[Met Office|UK Meteorological Office]]. [http://hadobs.metoffice.
היסטוריית הקובץ
ניתן ללחוץ על תאריך/שעה כדי לראות את הקובץ כפי שנראה באותו זמן.
| תאריך/שעה | תמונה ממוזערת | ממדים | משתמש | הערה | |
|---|---|---|---|---|---|
| נוכחית | 11:21, 7 באוקטובר 2009 | | 591 × 801 (126 ק"ב) | File Upload Bot (Magnus Manske) | {{BotMoveToCommons|en.wikipedia|year={{subst:CURRENTYEAR}}|month={{subst:CURRENTMONTHNAME}}|day={{subst:CURRENTDAY}}}} {{Information |Description={{en|This image shows the instrumental record of global average temperatures as compiled by the [[:en:Climat |
שימוש בקובץ
![]() אין בוויקיפדיה דפים המשתמשים בקובץ זה.
אין בוויקיפדיה דפים המשתמשים בקובץ זה.