
קובץ:Indicator function illustration.png

גודל התצוגה המקדימה הזאת: 800 × 508 פיקסלים. רזולוציות אחרות: 320 × 203 פיקסלים | 640 × 406 פיקסלים | 813 × 516 פיקסלים.
לקובץ המקורי (813 × 516 פיקסלים, גודל הקובץ: 19 ק"ב, סוג MIME: image/png)
| זהו קובץ שמקורו במיזם ויקישיתוף. תיאורו בדף תיאור הקובץ המקורי (בעברית) מוצג למטה. |
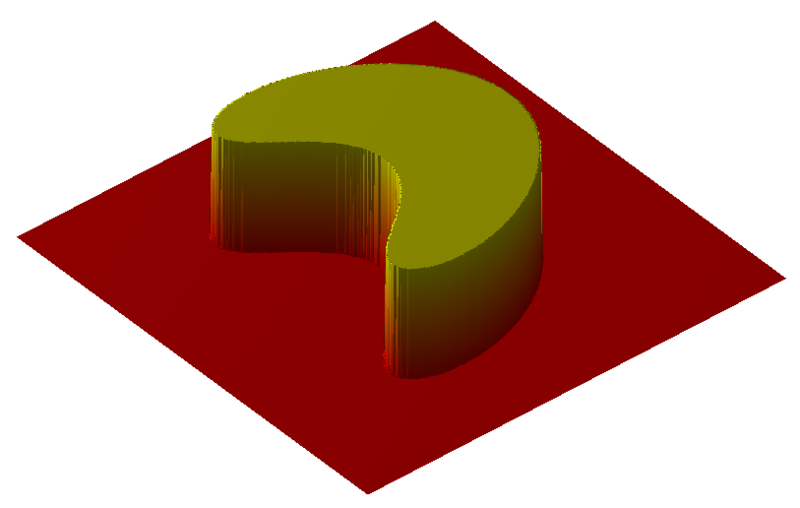
| תיאור | Illustration of an en:Indicator function. |
| תאריך יצירה | (UTC) |
| מקור | self-made with MATLAB, source code below |
| יוצר | Oleg Alexandrov |
. MATLAB עם נוצרה ה PNG תמונת מפת סיביות
| ברצוני, בעלי זכויות היוצרים על יצירה זו, לשחרר יצירה זו לנחלת הכלל. זה תקף בכל העולם. יש מדינות שבהן הדבר אינו אפשרי על פי חוק, אם כך: אני מעניק לכל אחד את הזכות להשתמש בעבודה זו לכל מטרה שהיא, ללא תנאים כלשהם, אלא אם כן תנאים כאלה נדרשים על פי חוק. |
Source code (MATLAB)
% illustration of an indicator function in two dimensions
function main()

   % the number of data points. More points means prettier picture.
   N = 400;

   % a function close to what we want, but not smooth
   Z = get_step_function (N);

% plot the surface
   figure(2); clf; hold on; axis equal; axis off;
   scale = 100;
   surf(scale*Z);

% make the surface beautiful
   shading interp;
   colormap autumn;

% add in a source of light
   camlight (-50, 54);

% viewing angle
   view(-40, 38);

   % save as png
   print('-dpng', '-r200', 'Indicator_function_illustration.png');


% get a function which is 1 on a set, and 0 outside of it
function Z = get_step_function(N)
   XX = linspace(-1.5, 4, N);
   YY = linspace(-4, 4, N);
   [X, Y] = meshgrid(XX, YY);

   c = 2;
   k=1.2;
   shift=10;
   Z = (c^2-X.^2-Y.^2).^2 + k*(c-X).^3-shift;

   Z =1-max(sign(Z), 0);

|
יש ליצור מחדש את התמונה math הזו באמצעות גרפיקה וקטורית כדוגמת קובץ SVG. לפעולה זו מספר יתרונות, כפי שניתן לקרוא (באנגלית) בדף Commons:Media for cleanup. אם ברשותכם קובץ SVG, אנא העלו אותו. לאחר מכן, החליפו תבנית זו בתבנית
{{vector version available|שם הקובץ.svg}} |
היסטוריית הקובץ
ניתן ללחוץ על תאריך/שעה כדי לראות את הקובץ כפי שנראה באותו זמן.
| תאריך/שעה | תמונה ממוזערת | ממדים | משתמש | הערה | |
|---|---|---|---|---|---|
| נוכחית | 04:49, 27 בספטמבר 2007 | | 516 × 813 (19 ק"ב) | Oleg Alexandrov | {{Information |Description=Illustration of an en:Indicator function. |Source=self-made with MATLAB, source code below |Date=~~~~~ |Author= Oleg Alexandrov }} <pre><nowiki> % illustration of an indicator function in two dime |
שימוש בקובץ
![]() אין בוויקיפדיה דפים המשתמשים בקובץ זה.
אין בוויקיפדיה דפים המשתמשים בקובץ זה.
שימוש גלובלי בקובץ
אתרי הוויקי השונים הבאים משתמשים בקובץ זה:
- שימוש באתר de.wikipedia.org
- שימוש באתר en.wikipedia.org
- שימוש באתר en.wikibooks.org
- שימוש באתר es.wikipedia.org
- שימוש באתר fi.wikipedia.org
- שימוש באתר fr.wikipedia.org
- שימוש באתר hi.wikipedia.org
- שימוש באתר id.wikipedia.org
- שימוש באתר it.wikipedia.org
- שימוש באתר ko.wikipedia.org
- שימוש באתר ms.wikipedia.org
- שימוש באתר nl.wikipedia.org
- שימוש באתר sq.wikipedia.org
- שימוש באתר sr.wikipedia.org
- שימוש באתר sv.wikipedia.org
- שימוש באתר ta.wikipedia.org
- שימוש באתר uk.wikipedia.org
- שימוש באתר vi.wikipedia.org