
קובץ:Foreclosure trend - 2007.svg

לקובץ המקורי (קובץ SVG, הגודל המקורי: 395 × 407 פיקסלים, גודל הקובץ: 15 ק"ב)
| זהו קובץ שמקורו במיזם ויקישיתוף. תיאורו בדף תיאור הקובץ המקורי (בעברית) מוצג למטה. |
תקציר
| תיאור |
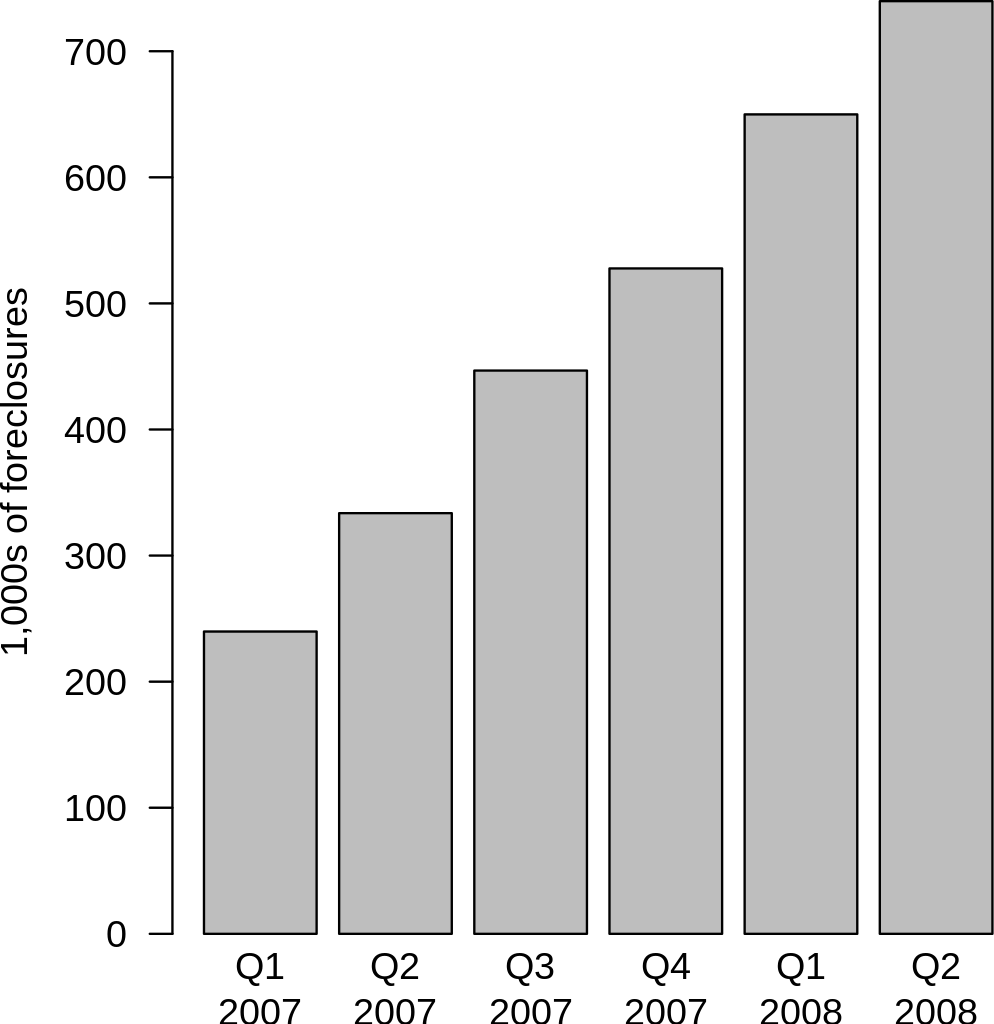
English: This data was publicly disclosed by RealtyTrac through press releases available on their website, some of which are cited in the 2007 Subprime Mortgage Financial Crisis article directly. I created the table from this data. I have calculated the Q1 and Q2 2007 data as follows:
Note that this adds to 1,547,863, not the 1,285,873 RealtyTrac cited for full year. The following is an explanation from RealtyTrac: "The reason for the numbers not adding up is that we run the reports for the year-end separately; we don’t just add up all the quarters. Because of the way the report is designed, it only counts each property once during the entire year even if the property has multiple filings against it during the timeframe used for the report. So when we run it for the entire year, the number will be lower than adding up all the quarters because there will be some properties that appeared in multiple quarters because they had foreclosure activity against them in more than one quarter." RealtyTrac includes default notices, auction sale notices and bank repossessions in its reporting and can include multiple filings on the same property. The number of total notices was 2.2 million for 2007, as cited in the year-end press release. |
| מקור | נוצר על־ידי מעלה היצירה |
| יוצר | Emok |
| גרסאות אחרות | Image:Foreclosure_Trend_-_2007.png |
R source code:
date<-c("Q1\n2007","Q2\n2007","Q3\n2007","Q4\n2007","Q1\n2008","Q2\n2008")
foreclosures<-c(239770,333627,446726,527740,649917,739714)
pdf('foreclosures.pdf', width=5, height=6)
barplot(foreclosures/1000, ylab="1,000s of foreclosures", las=1, names.arg=date)
dev.off()
רישיון
- הנכם רשאים:
- לשתף – להעתיק, להפיץ ולהעביר את העבודה
- לערבב בין עבודות – להתאים את העבודה
- תחת התנאים הבאים:
- ייחוס – יש לתת ייחוס הולם, לתת קישור לרישיון, ולציין אם נעשו שינויים. אפשר לעשות את זה בכל צורה סבירה, אבל לא בשום צורה שמשתמע ממנה שמעניק הרישיון תומך בך או בשימוש שלך.
- שיתוף זהה – אם תיצרו רמיקס, תשנו, או תבנו על החומר, חובה עליכם להפיץ את התרומות שלך לפי תנאי רישיון זהה או תואם למקור.

|
מוענקת בכך הרשות להעתיק, להפיץ או לשנות את המסמך הזה, לפי תנאי הרישיון לשימוש חופשי במסמכים של גנו, גרסה 1.2 או כל גרסה מאוחרת יותר שתפורסם על־ידי המוסד לתוכנה חופשית; ללא פרקים קבועים, ללא טקסט עטיפה קדמית וללא טקסט עטיפה אחורית. עותק של הרישיון כלול בפרק שכותרתו הרישיון לשימוש חופשי במסמכים של גנו. |
היסטוריית הקובץ
ניתן ללחוץ על תאריך/שעה כדי לראות את הקובץ כפי שנראה באותו זמן.
| תאריך/שעה | תמונה ממוזערת | ממדים | משתמש | הערה | |
|---|---|---|---|---|---|
| נוכחית | 21:10, 24 בספטמבר 2008 | | 407 × 395 (15 ק"ב) | Emok | {{Information |Description={{en|1=This data was publicly disclosed by RealtyTrac through press releases available on their website, some of which are cited in the 2007 Subprime Mortgage Financial Crisis article directly. I created the table from this dat |
שימוש בקובץ
![]() אין בוויקיפדיה דפים המשתמשים בקובץ זה.
אין בוויקיפדיה דפים המשתמשים בקובץ זה.
שימוש גלובלי בקובץ
אתרי הוויקי השונים הבאים משתמשים בקובץ זה:
- שימוש באתר en.wikipedia.org
- שימוש באתר th.wikipedia.org
- שימוש באתר vi.wikipedia.org