
קובץ:Eu-estimation-tolerance-absolute.svg

גודל התצוגה המקדימה הזאת מסוג PNG של קובץ ה־SVG הזה: 300 × 300 פיקסלים. רזולוציות אחרות: 240 × 240 פיקסלים | 480 × 480 פיקסלים | 768 × 768 פיקסלים | 1,024 × 1,024 פיקסלים | 2,048 × 2,048 פיקסלים.
לקובץ המקורי (קובץ SVG, הגודל המקורי: 300 × 300 פיקסלים, גודל הקובץ: 10 ק"ב)
| זהו קובץ שמקורו במיזם ויקישיתוף. תיאורו בדף תיאור הקובץ המקורי (בעברית) מוצג למטה. |
תקציר
| תיאור | |
| תאריך יצירה | |
| מקור |
Self-made in gnuplot. . Gnuplot עם נוצרה ה תמונה |
| יוצר | Nils R. Barth |
| גרסאות אחרות | File:Eu-estimation-tolerance-relative.svg (relative tolerances) |
gnuplot source
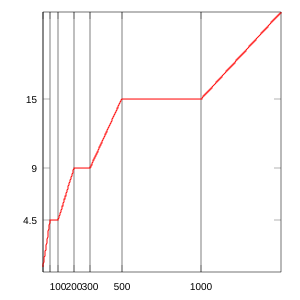
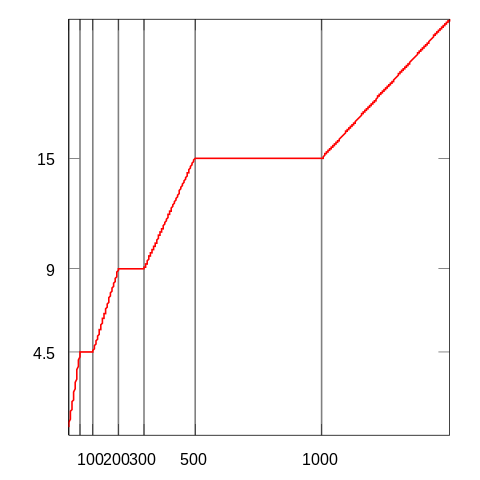
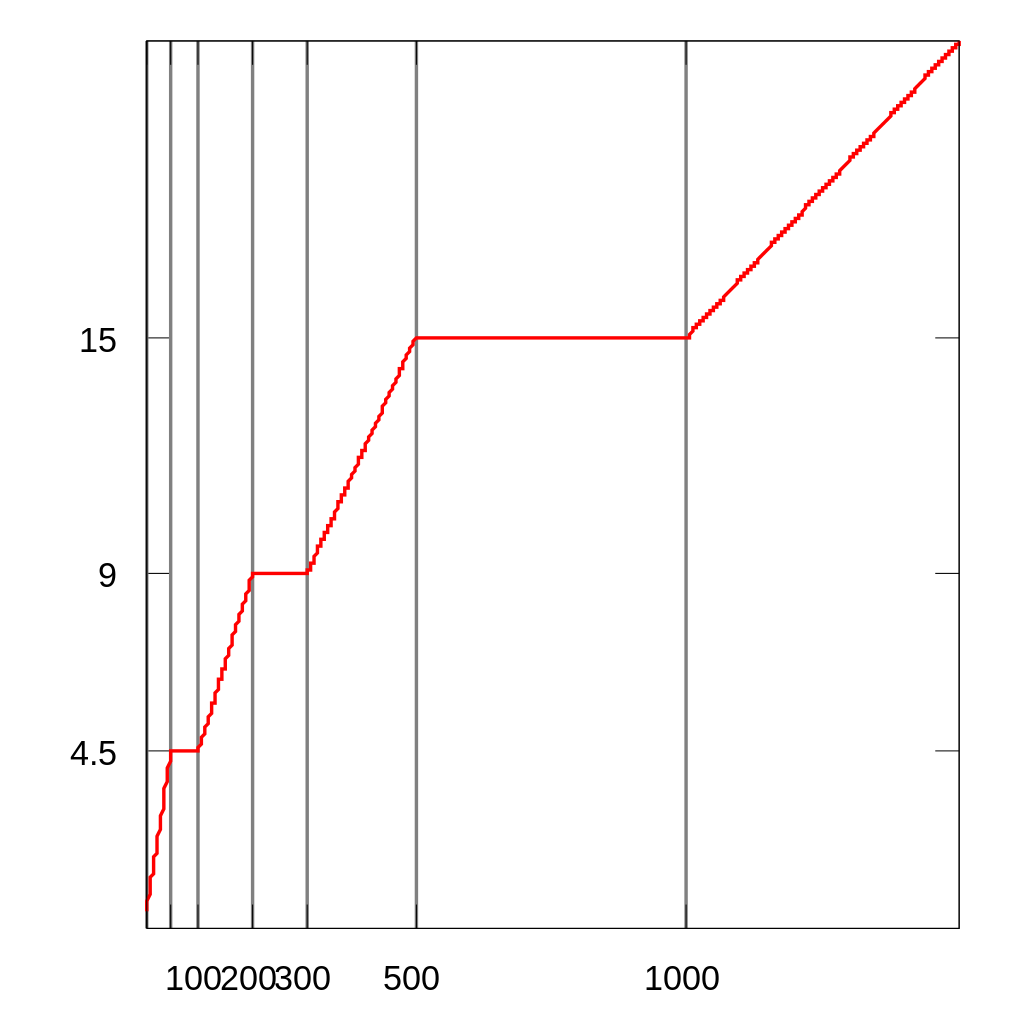
# Graphs of errors for the EU “estimated sign”

# Set terminal
set terminal svg enhanced size 300 300 fs 10
set samples 1001  # high quality
set border 31 linewidth .3 # thin border
unset key # no key

# Tolerable error function:
#  input is nominal quantity
#  output is tolerable negative error, as an absolute quantity
#
# e(x)/x is thus tolerable ~relative~ error
#
e(x) = x <   50 ?   9e-2 * x  \
     : x <  100 ?        4.5  \
     : x <  200 ? 4.5e-2 * x  \
     : x <  300 ?        9    \
     : x <  500 ?   3e-2 * x  \
     : x < 1000 ?       15    \
     :            1.5e-2 * x

# X-range and x-tics

# Set x tics at the cutoff points
set xtics ("" 5, "" 50, "100" 100, "200" 200, "300" 300, "500" 500, "1000" 1000)

# Set representative x-range:
#  undefined below 5, and
#  extending above 1500 to 10,000 just shrinks the interesting part of the graph
#
# (A log-scale on the x-axis would fit everything in, but obscure the linearity
#  in the absolute error; it would be ok in the relative error though.)
set xrange [5:1500]

# Draw the x grid, to show ranges
set grid x

####################
# Absolute error
####################

# Set y tics at the fixed amounts
set ytics (4.5,9,15)

# Set y-range to go from 0 to max (over this x-range)
set yrange [0:22.5]

set output "eu-estimation-tolerance-absolute.svg"
plot e(x)

####################
# Relative error
####################

# Set y-tics at the fixed percentages
set ytics (1.5, 3, 4.5, 9)

# Set y-range (0% – 10%) to include all percentages, with clearance for 9%.
set yrange [0:10]
set format y "%g %%" # Format as percentage

set output "eu-estimation-tolerance-relative.svg"
# Multiply by 100 so as a percentage
plot e(x)/x*100
רישיון
Nils R. Barth, בעל זכויות היוצרים על היצירה הזאת, מפרסם אותה בזאת תחת הרישיון הבא:
| ברצוני, בעלי זכויות היוצרים על יצירה זו, לשחרר יצירה זו לנחלת הכלל. זה תקף בכל העולם. יש מדינות שבהן הדבר אינו אפשרי על פי חוק, אם כך: אני מעניק לכל אחד את הזכות להשתמש בעבודה זו לכל מטרה שהיא, ללא תנאים כלשהם, אלא אם כן תנאים כאלה נדרשים על פי חוק. |
היסטוריית הקובץ
ניתן ללחוץ על תאריך/שעה כדי לראות את הקובץ כפי שנראה באותו זמן.
| תאריך/שעה | תמונה ממוזערת | ממדים | משתמש | הערה | |
|---|---|---|---|---|---|
| נוכחית | 06:24, 25 במרץ 2009 | | 300 × 300 (10 ק"ב) | Nbarth | Thinner border. |
| 06:09, 25 במרץ 2009 |  | 300 × 300 (8 ק"ב) | Nbarth | Fix nominal size so agrees with target size (300, not 1000). | |
| 05:56, 25 במרץ 2009 |  | 1,000 × 1,000 (13 ק"ב) | Nbarth | Smaller text to avoid collision | |
| 05:54, 25 במרץ 2009 |  | 1,000 × 1,000 (13 ק"ב) | Nbarth | Thicker lines, bigger text | |
| 05:01, 25 במרץ 2009 |  | 1,000 × 1,000 (14 ק"ב) | Nbarth | {{Information |Description={{en|1=Absolute estimation tolerances for the European Union estimated sign.}} |Source=Own work by uploader |Author=Nbarth |Date=2009-03-25 |Permission= |other_versio |
שימוש בקובץ
![]() אין בוויקיפדיה דפים המשתמשים בקובץ זה.
אין בוויקיפדיה דפים המשתמשים בקובץ זה.
שימוש גלובלי בקובץ
אתרי הוויקי השונים הבאים משתמשים בקובץ זה:
- שימוש באתר ca.wikipedia.org
- שימוש באתר en.wikipedia.org
- שימוש באתר es.wikipedia.org
- שימוש באתר fa.wikipedia.org
- שימוש באתר ja.wikipedia.org