
קובץ:Co2-temperature-records.svg

גודל התצוגה המקדימה הזאת מסוג PNG של קובץ ה־SVG הזה: 720 × 540 פיקסלים. רזולוציות אחרות: 320 × 240 פיקסלים | 640 × 480 פיקסלים | 1,024 × 768 פיקסלים | 1,280 × 960 פיקסלים | 2,560 × 1,920 פיקסלים.
לקובץ המקורי (קובץ SVG, הגודל המקורי: 720 × 540 פיקסלים, גודל הקובץ: 225 ק"ב)
| זהו קובץ שמקורו במיזם ויקישיתוף. תיאורו בדף תיאור הקובץ המקורי (בעברית) מוצג למטה. |
תקציר
| תיאור |
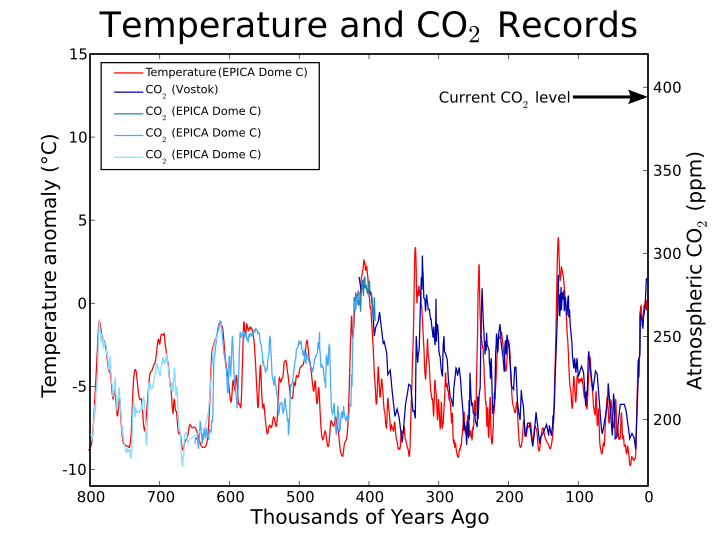
English: This figure shows historical carbon dioxide (right axis) and reconstructed temperature (as a difference from the mean temperature for the last 100 years) records based on Antarctic ice cores, providing data for the last 800,000 years.
This figure was produced by Leland McInnes using python and matplotlib and is licensed under the GFDL. All data is from publicly available sources.
|
| תאריך יצירה | |
| מקור | נוצר על־ידי מעלה היצירה (Own work) |
| יוצר | Leland_McInnes (talk) (Uploads) |
| גרסאות אחרות |
|
.png)
![CO2 at Mauna Loa since 1958. [1] [2]](http://commons.wikimedia.org/wiki/File:Co2maunaloa2003.png)

![]] and greenhouse gases during 420,000 years.](http://commons.wikimedia.org/wiki/File:Vostok_420ky_4curves_insolation.jpg)


Source code
The image was created with the following script, making use of the matplotlib library.
# -*- coding: utf-8 -*-
import numpy as np
import matplotlib.pylab as plt
from matplotlib.font_manager import FontProperties
def smooth(signal, window_size):
extended_signal = signal[window_size:0:-1] + signal + signal[-1:-window_size:-1]
s = np.array(extended_signal)
w = np.hamming(window_size)
y = np.convolve(w/w.sum(), s, mode="same")
return y[window_size:-window_size+1]

temp_file = open("EDC_dD_temp_estim.csv")
data_rows = [x.split() for x in temp_file if not x.startswith("#") and len(x.split()) == 5]
temp_years = [float(x[1]) for x in data_rows]
raw_temp_vals = [float(x[3]) for x in data_rows]
temp_vals = list(smooth(raw_temp_vals[:4000], 50)) + list(smooth(raw_temp_vals[4000:6000], 10)) + raw_temp_vals[6000:]
co2_file1 = open("Vostok_CH4_CO2_age.csv")
data_rows = [x.split("\t") for x in co2_file1 if not x.startswith('"')]
co2_years1 = [float(x[0]) for x in data_rows if x[2] != "\n"]
co2_vals1 = [float(x[2].strip()) for x in data_rows if x[2] != "\n"]
co2_file2 = open("EDC_CO2_423-391_kyr_BP.csv")
data_rows = [x.split() for x in co2_file2 if not x.startswith('"')]
co2_years2 = [float(x[1]) for x in data_rows]
co2_vals2 = [float(x[2]) for x in data_rows]
co2_file3 = open("EDC_CO2_650-413_kyr_BP.csv")
data_rows = [x.split() for x in co2_file3 if not x.startswith('"')]
co2_years3 = [float(x[1]) for x in data_rows]
co2_vals3 = [float(x[2]) for x in data_rows]
co2_file4 = open("EDC99_CO2_bern.csv")
data_rows = [x.split() for x in co2_file4 if x.startswith("3")]
co2_years4 = [float(x[1]) for x in data_rows]
co2_vals4 = [float(x[2]) for x in data_rows]
plt.title("Temperature and CO$_2$ Records", size=28)
temp_ax = plt.axes()
temp_ax.yaxis.tick_left()
tline = plt.plot(temp_years, temp_vals, "red")
plt.ylabel(u"Temperature anomaly (°C)", size=16)
plt.xlabel("Thousands of Years Ago", size=16)
plt.xlim(800,0)
plt.ylim(-11,15)
co2_ax = plt.axes([0.125,0.1,0.775,0.8], frameon=False)
co2_ax.yaxis.tick_right()
co2_ax.yaxis.set_label_position("right")
plt.xticks([])
cline1 = plt.plot(co2_years1, co2_vals1, "#0000AA")
cline2 = plt.plot(co2_years2, co2_vals2, "#2288AA")
cline3 = plt.plot(co2_years3, co2_vals3, "#44AAFF")
cline4 = plt.plot(co2_years4, co2_vals4, "#88DDFF")
plt.ylabel("Atmospheric CO$_2$ (ppm)", size=16)
plt.xlim(800,0)
plt.ylim(160,420)
plt.annotate("Current CO$_2$ level", (2,386.36), (300,386.36), xycoords="data", arrowprops=dict(arrowstyle="->"))
plt.legend((tline, cline1, cline2, cline3, cline4), ("Temperature (EPICA Dome C)", "CO$_2$ (Vostok)", "CO$_2$ (EPICA Dome C)", "CO$_2$ (EPICA Dome C)", "CO$_2$ (EPICA Dome C)"), "upper left", prop=FontProperties(size=9), pad=0.1, handletextsep=0.005)
plt.savefig("py-co2-temp.svg")
plt.show()
רישיון
Leland McInnes בוויקיפדיה האנגלית, בעל זכויות היוצרים על היצירה הזאת, מפרסם אותה בזאת תחת הרישיון הבא:
| הקובץ הזה מתפרסם לפי תנאי רישיון קריאייטיב קומונז ייחוס-שיתוף זהה 3.0 לא מותאם. Subject to disclaimers. | ||
| ייחוס: Leland McInnes בוויקיפדיה האנגלית | ||
| ||
| תבנית רישוי זו הוספה לקובץ כחלק מעדכון רישיון GFDL. |

|
מוענקת בכך הרשות להעתיק, להפיץ או לשנות את המסמך הזה, לפי תנאי הרישיון לשימוש חופשי במסמכים של גנו, גרסה 1.2 או כל גרסה מאוחרת יותר שתפורסם על־ידי המוסד לתוכנה חופשית; ללא פרקים קבועים, ללא טקסט עטיפה קדמית וללא טקסט עטיפה אחורית. עותק של הרישיון כלול בפרק שכותרתו הרישיון לשימוש חופשי במסמכים של גנו. Subject to disclaimers. |
יומן העלאה מקורי
תיאור הקובץ המקורי נמצא כאן. כל שמות המשתמשים הבאים מתייחסים ל-en.wikipedia.
| תאריך/שעה | ממדים | משתמש | הערה |
|---|---|---|---|
| 2009-01-11 20:50 | 720×540× (230122 bytes) | Leland McInnes | |
| 2007-01-14 00:29 | 1052×744× (40671 bytes) | Leland McInnes | (reverse direction of time scale) |
| 2006-11-04 17:22 | 1052×744× (40730 bytes) | Leland McInnes | |
| 2006-11-04 04:07 | 1052×744× (42937 bytes) | Leland McInnes | |
| 2006-11-04 04:03 | 1052×744× (42931 bytes) | Leland McInnes | One last try at entering the title |
| 2006-11-04 03:56 | 1052×744× (39678 bytes) | Leland McInnes | |
| 2006-11-04 01:04 | 1052×744× (40314 bytes) | Leland McInnes | |
| 2006-11-04 01:02 | 1052×744× (40272 bytes) | Leland McInnes | This figure shows apparent correlations between historical CO2 and temperature records based on Antarctic ice cores, providing data for the last 650,000 years. Note that deuterium levels differ between Vostok and EPICA ice cores and are therefore plotted |
. Matplotlib עם נוצרה ה תמונה
היסטוריית הקובץ
ניתן ללחוץ על תאריך/שעה כדי לראות את הקובץ כפי שנראה באותו זמן.
| תאריך/שעה | תמונה ממוזערת | ממדים | משתמש | הערה | |
|---|---|---|---|---|---|
| נוכחית | 08:21, 6 בספטמבר 2015 | | 540 × 720 (225 ק"ב) | OgreBot | (BOT): Reverting to most recent version before archival |
| 08:21, 6 בספטמבר 2015 |  | 744 × 1,052 (40 ק"ב) | OgreBot | (BOT): Uploading old version of file from en.wikipedia; originally uploaded on 2007-01-14 00:29:34 by Leland McInnes | |
| 08:21, 6 בספטמבר 2015 |  | 744 × 1,052 (40 ק"ב) | OgreBot | (BOT): Uploading old version of file from en.wikipedia; originally uploaded on 2006-11-04 17:22:45 by Leland McInnes | |
| 08:21, 6 בספטמבר 2015 |  | 744 × 1,052 (42 ק"ב) | OgreBot | (BOT): Uploading old version of file from en.wikipedia; originally uploaded on 2006-11-04 04:07:29 by Leland McInnes | |
| 08:21, 6 בספטמבר 2015 |  | 744 × 1,052 (42 ק"ב) | OgreBot | (BOT): Uploading old version of file from en.wikipedia; originally uploaded on 2006-11-04 04:03:23 by Leland McInnes | |
| 08:21, 6 בספטמבר 2015 |  | 744 × 1,052 (39 ק"ב) | OgreBot | (BOT): Uploading old version of file from en.wikipedia; originally uploaded on 2006-11-04 03:56:48 by Leland McInnes | |
| 08:21, 6 בספטמבר 2015 |  | 744 × 1,052 (39 ק"ב) | OgreBot | (BOT): Uploading old version of file from en.wikipedia; originally uploaded on 2006-11-04 01:04:39 by Leland McInnes | |
| 08:21, 6 בספטמבר 2015 |  | 744 × 1,052 (39 ק"ב) | OgreBot | (BOT): Uploading old version of file from en.wikipedia; originally uploaded on 2006-11-04 01:02:05 by Leland McInnes | |
| 04:24, 5 בספטמבר 2015 |  | 540 × 720 (225 ק"ב) | Hiperfelix | Transferred from en.wikipedia |
שימוש בקובץ
![]() אין בוויקיפדיה דפים המשתמשים בקובץ זה.
אין בוויקיפדיה דפים המשתמשים בקובץ זה.
שימוש גלובלי בקובץ
אתרי הוויקי השונים הבאים משתמשים בקובץ זה:
- שימוש באתר de.wikipedia.org
- שימוש באתר en.wikipedia.org
- שימוש באתר es.wikipedia.org
- שימוש באתר fa.wikipedia.org
- שימוש באתר it.wikibooks.org