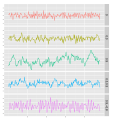
קובץ:ArTimeSeries.svg
מראה

גודל התצוגה המקדימה הזאת מסוג PNG של קובץ ה־SVG הזה: 685 × 448 פיקסלים. רזולוציות אחרות: 320 × 209 פיקסלים | 640 × 419 פיקסלים | 1,024 × 670 פיקסלים | 1,280 × 837 פיקסלים | 2,560 × 1,674 פיקסלים.
לקובץ המקורי (קובץ SVG, הגודל המקורי: 685 × 448 פיקסלים, גודל הקובץ: 177 ק"ב)
היסטוריית הקובץ
ניתן ללחוץ על תאריך/שעה כדי לראות את הקובץ כפי שנראה באותו זמן.
| תאריך/שעה | תמונה ממוזערת | ממדים | משתמש | הערה | |
|---|---|---|---|---|---|
| נוכחית | 06:28, 15 בינואר 2013 |  | 448 × 685 (177 ק"ב) | Everettr2 | I tried to clarify the identity of each of the five plots in the graph. |
| 22:16, 13 בינואר 2013 |  | 448 × 604 (167 ק"ב) | Everettr2 | Reverted to version as of 22:28, 30 March 2011 | |
| 22:15, 13 בינואר 2013 |  | 792 × 612 (227 ק"ב) | Everettr2 | Trying to clearly identify each of the 5 plots in the graph | |
| 22:14, 13 בינואר 2013 |  | 448 × 604 (167 ק"ב) | Everettr2 | Reverted to version as of 22:28, 30 March 2011 | |
| 21:41, 13 בינואר 2013 |  | 792 × 612 (192 ק"ב) | Everettr2 | Added descriptive elements to better identify each of the five plots in the graphic. | |
| 00:28, 31 במרץ 2011 |  | 448 × 604 (167 ק"ב) | Tomaschwutz | changed to area between zero and line instead of line only | |
| 19:44, 30 במרץ 2011 |  | 519 × 488 (167 ק"ב) | Tomaschwutz | {{Information |Description ={{en|1=Timeseries of several AR(p) processes with standard deviation of the noise of 1}} |Source ={{own}} |Author =Tomaschwutz |Date =2011-03-30 |Permission = |other_version |
שימוש בקובץ
הדף הבא משתמש בקובץ הזה:
שימוש גלובלי בקובץ
אתרי הוויקי השונים הבאים משתמשים בקובץ זה:
- שימוש באתר en.wikipedia.org
- שימוש באתר ja.wikipedia.org
- שימוש באתר ko.wikipedia.org
- שימוש באתר uk.wikipedia.org
